Figure 1.

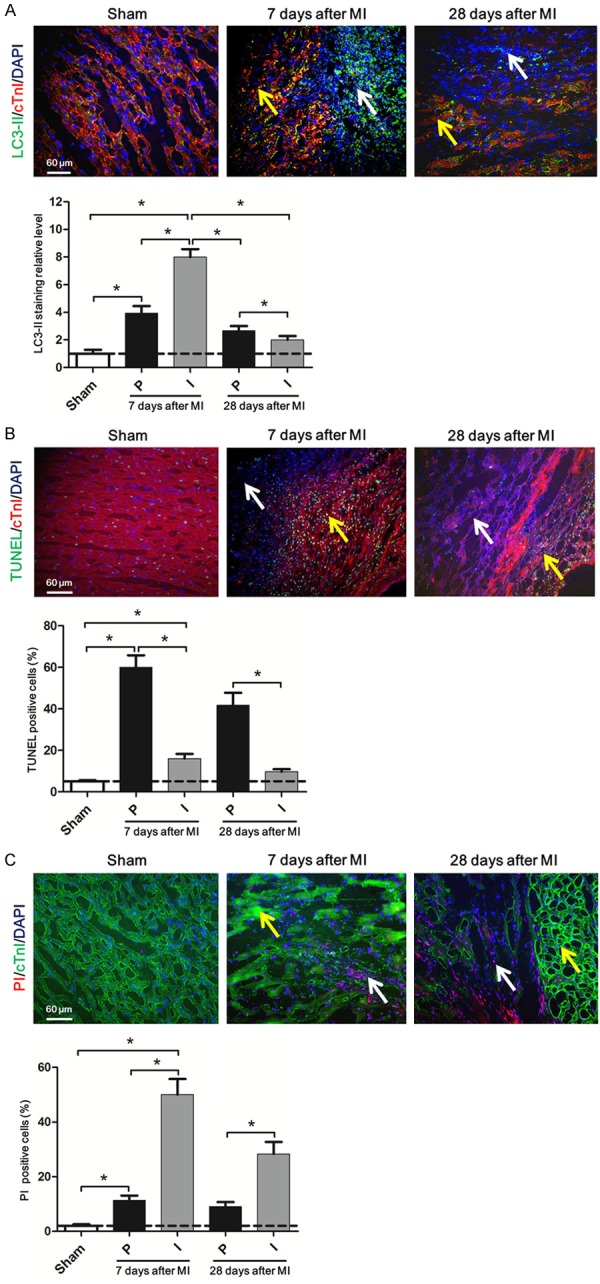
Autophagy, apoptosis and necroptosis occurred in the heart after myocardial infarction. A. Representative immunofluorescent images of staining with LC3-II (green), cTnI (red), and DAPI (blue) in the heart tissue of SD rats 7 days, 28 days after coronary artery ligation are shown. The white arrow indicates the infarct zones and yellow arrow indicates the peri-infarct zones. The scale bar in the lower left corner of image is 60 μm. Below is the same. The lower bar graph shows the quantitative analysis of the percent of LC3-II positive cells. B. Upper: Representative immunofluorescent images of staining with TUNEL (green), cTnI (red), and DAPI (blue) in the heart tissue of SD rats 7 days and 28 days after MI are shown. Lower: The bar graph shows quantitative analysis of the percent of TUNEL positive cells. C. Upper: Representative immunofluorescent images of staining with PI (red), cTnI (green), and DAPI (blue) in the heart tissue of SD rats 7 days and 28 days after MI are shown. Lower: The bar graph shows quantitative analysis of the percent of PI positive cells. Data are expressed as mean ± SD, n=4, *P<0.05.
