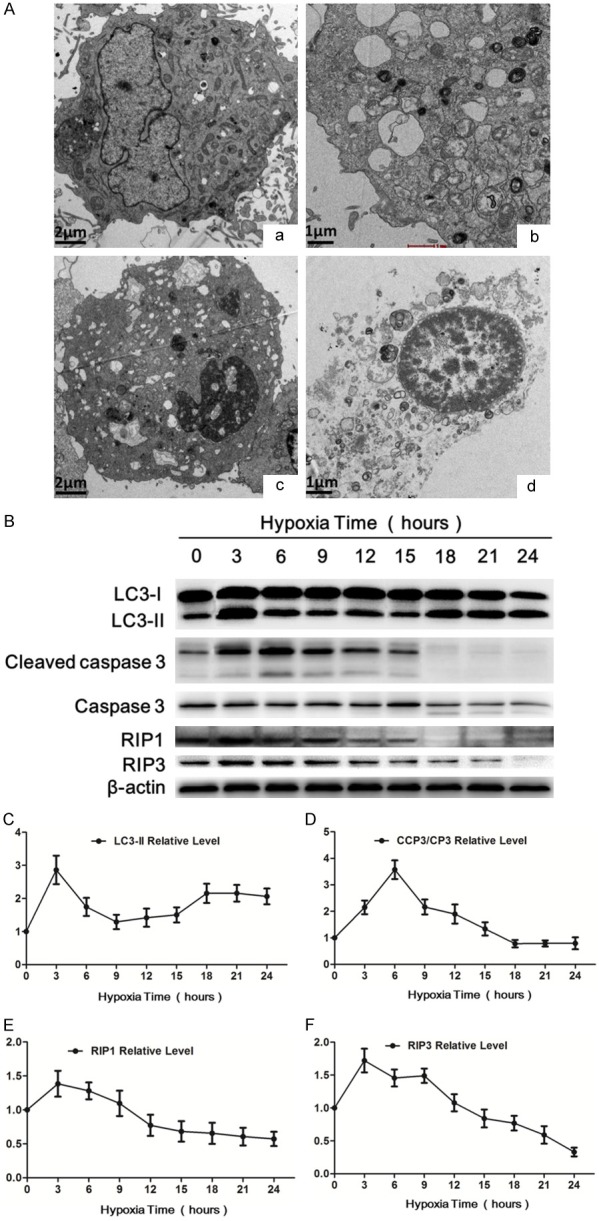
Figure 3.

In vitro hypoxia treatment induced autophagy, apoptosis and necroptosis in H9c2 cells. (A) Transmission electron microscope (TEM) was used to observe cellular morphology changes. a. Control group showing the viable H9c2 cell morphology, (b-d) Hypoxia groups, (b) TEM detected autophagosomes in H9c2 cells after hypoxia for 3 h. (c) Apoptotic cell showing nuclear shrinkage and chromatin condensation was observed in H9c2 cells after hypoxia for 6 hours. (d) Necroptotic cell showing swollen nucleus, increased cell volume and disrupted cell membrane integrity with translucent cytoplasm was observed in H9c2 cell after hypoxia for 9 hours. (B) Western blot showing the LC3-I, LC3-II, cleaved caspase 3, caspase 3, RIP1, RIP3 protein levels in H9c2 cells after hypoxia for indicated hours. β-actin was used as the loading control. (C-F) Showing the quantitative analysis of the above protein levels after hypoxia for indicated hours, respectively. Data are expressed as mean ± SD, n=4.
