Figure 6.

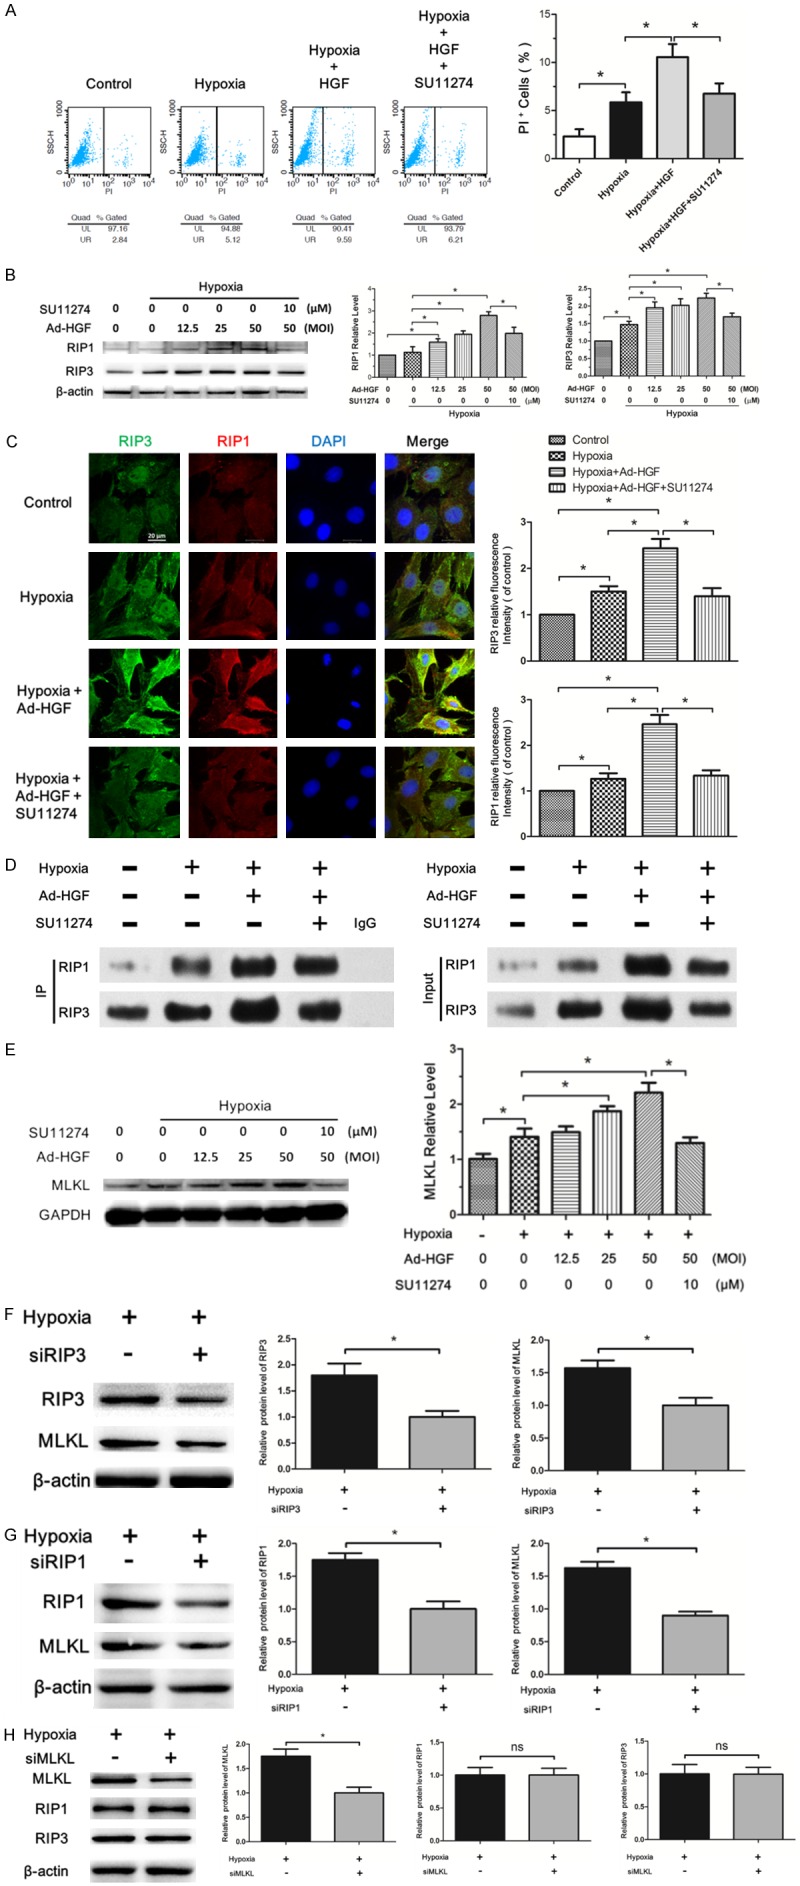
HGF promotes necroptosis in H9c2 cells under hypoxia. A. Flow cytometry analysis showing the percent of PI positive H9c2 cells under the indicated treatment. The statistical analysis of the result was described in the bar chat. B. Western blot analysis for the RIP1 and RIP3 protein level in H9c2 cells treated with Ad-HGF, SU11274, hypoxia or negative control as indicated. The bar graph displayed the statistical analysis of the above protein levels. C. Representative confocal images of RIP3 (green), RIP1 (red), and DAPI (blue) in H9c2 cells from the indicated groups. The pictures were captured using confocal fluorescence microscopy at uniform exposure. The bar chart described the relative fluorescence intensity of the staining proteins. D. The changes of RIP1-RIP3 complex in H9c2 cells after the indicated treatment, indicated by immunoprecipitation. E. Western blot for MLKL level in H9c2 cells under the indicated treatment. F-H. The lysates from H9c2 cells transfected with or without siRNA targeted RIP3, RIP1 or MLKL were analyzed by western blot with antibodies against RIP3, MLKL, RIP1 as indicated. The bar chart showed the statistical analysis of the according proteins. Data are expressed as mean ± SD, n=3, *P<0.05.
