
Figure 4.
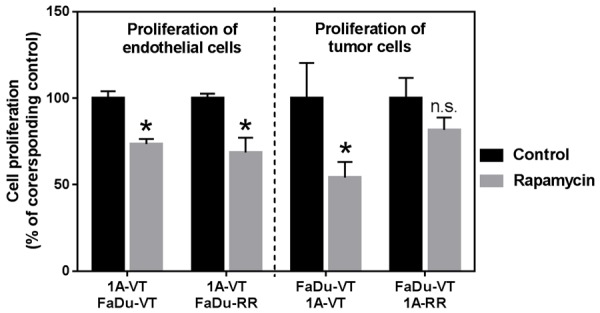
Cell proliferation of HMEC-1A (1A) shown on the left and FaDu cancer cells shown on the right that were co-cultured and treated with mTOR inhibitor rapamycin (0 and 10 ng/ml). VT-vector-transfected; RR-rapamycin-resistant mTOR transfected cells. Data is expressed as percent of control. Data represents mean ± SD for n>3 expeirments. Data was analyzed using Two sample independent student’s t test. *indicates P<0.05 relative to corresponding control, n.s.-not statistically significant.