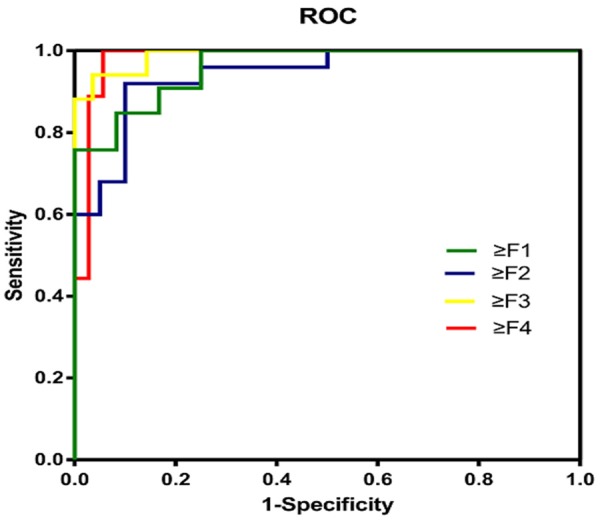
Figure 5.

ROC analysis of the diagnostic ability of MRE for hepatic fibrosis. Four ROC curves are shown to indicate the ability of this MRE protocol to discriminate each fibrosis stage. The green curve shows F0 vs. F1-4, and the AUC of the ROC curve was 0.96, with a cut-off value of 1.105 kPa. Sensitivity, specificity and accuracy were 97.4%, 80.0% and 92.5%, respectively. The blue curve shows F0-1 vs. F2-4, and the AUC of the ROC curve was 0.954, with a cut-off value of 1.365 kPa. Sensitivity, specificity and accuracy were 92.6%, 92.3% and 92.5%, respectively. The yellow curve shows F0-2 vs. F3-4, and the AUC of the ROC curve was 0.992, with a cut-off value of 1.69 kPa. Sensitivity, specificity and accuracy were 94.7%, 97.1% and 96.2%, respectively. The red curve shows F0-3 vs. F4, and the AUC of the ROC curve was 0.99, with a cut-off value of 2.027 kPa. Sensitivity, specificity and accuracy were 100%, 97.6% and 98.1%, respectively.
