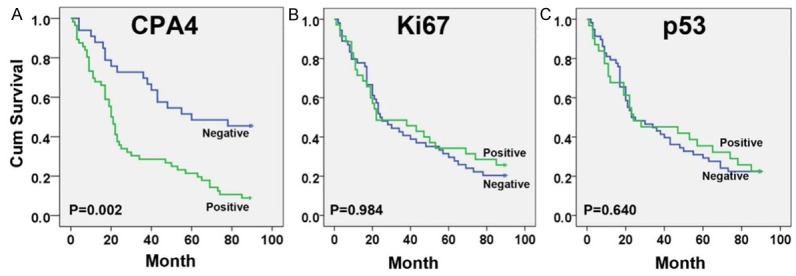
Figure 2.

Survival curves for GC using the Kaplan-Meier method and the log-rank test. A. Overall survival curves for patients with negative CPA4 expression (blue line) and patients with positive CPA4 (green line); B. Overall survival curves for patients with negative Ki67 expression (blue line) and patients with positive Ki67 (green line); C. Overall survival curves for patients with negative p53 expression (green line) and patients with positive p53 (blue line).
