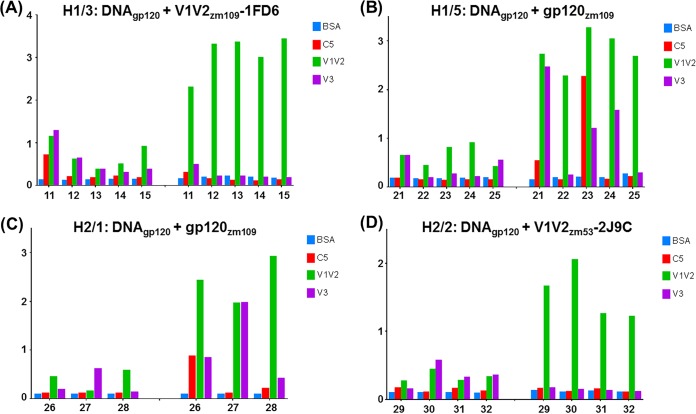
FIG 4.
Specificity of the Ab response. The average OD values of replicates from ELISAs are shown on the y axis for sera from individual animals tested for reactivity against BSA, C5 peptide, V1V2ZM109-1FD6, and a consensus C V3 peptide. The responses are shown for sera diluted 1:100 from each animal (numbered on the x axis). The left half of each graph shows the results with sera collected 2 weeks after the third priming immunization. The right half of each graph shows the responses obtained with sera collected 2 weeks after the second boost.

