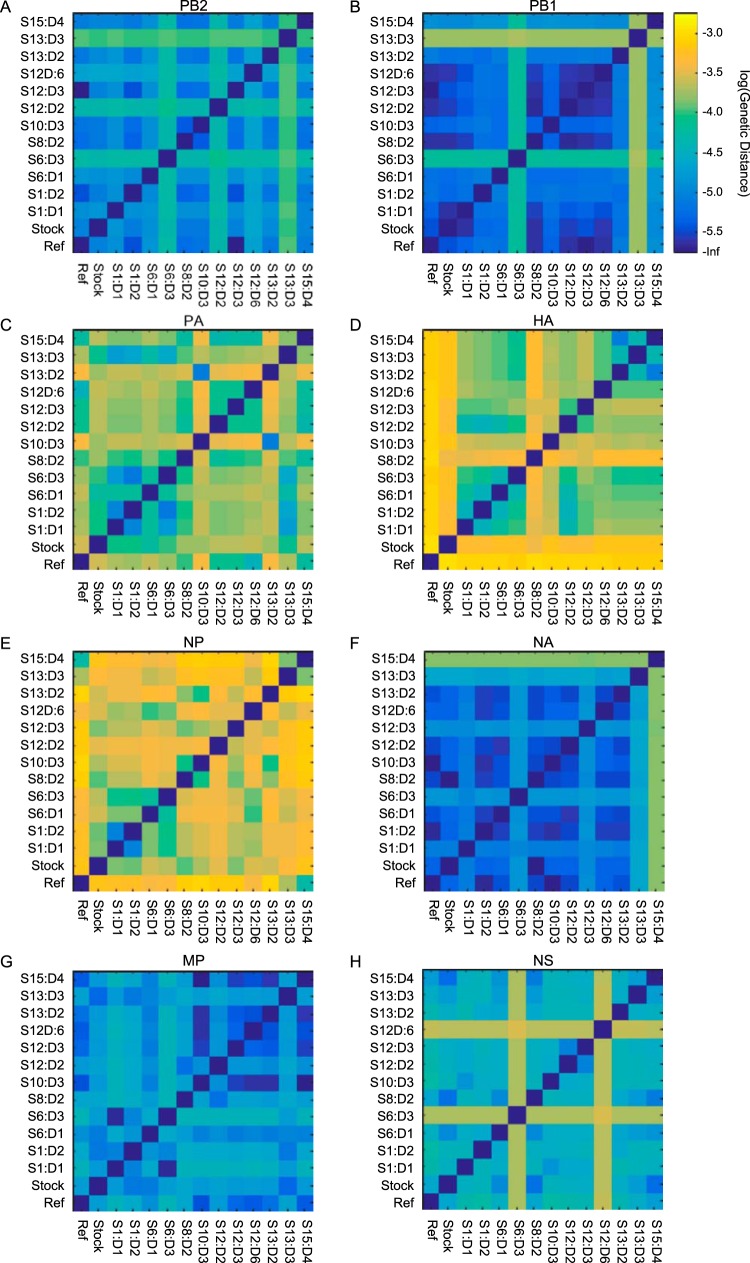
FIG 3.
Mean pairwise genetic distance plots between viral populations by gene segment. Ref, reference strain A/Wisconsin/67/2005(H3N2). Genetic distances are shown on the log scale, with lighter colors corresponding to larger mean pairwise genetic distances. Calculation of pairwise distances used sites that had variants called at a 1% cutoff in at least one sample.

