
FIG 4.
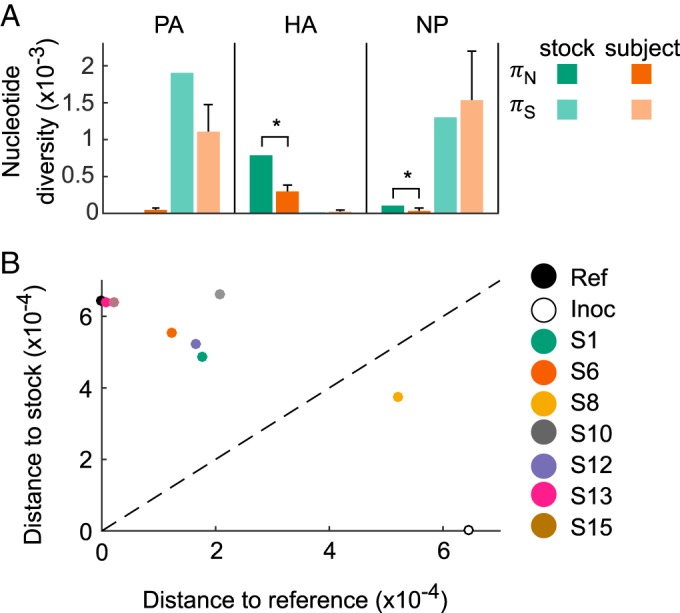
Nucleotide diversity levels and genetic distances. (A) Levels of nonsynonymous and synonymous nucleotide diversity in the viral stock and in the subjects' first nasal wash samples. For subjects, mean diversity levels are shown, with error bars showing standard deviations (SD). In the HA and NP gene segments, πN is significantly lower in the subjects' first nasal wash samples than in the viral stock (*, P < 0.05 using a one-sample Z-test). (B) HA genetic distances between the subjects' first nasal wash samples, the reference strain, and the viral stock, excluding nucleotide site 70. Nasal wash samples are colored by subject. The dashed x = y line shows where the distance to the viral stock is equal to the distance to the reference strain.