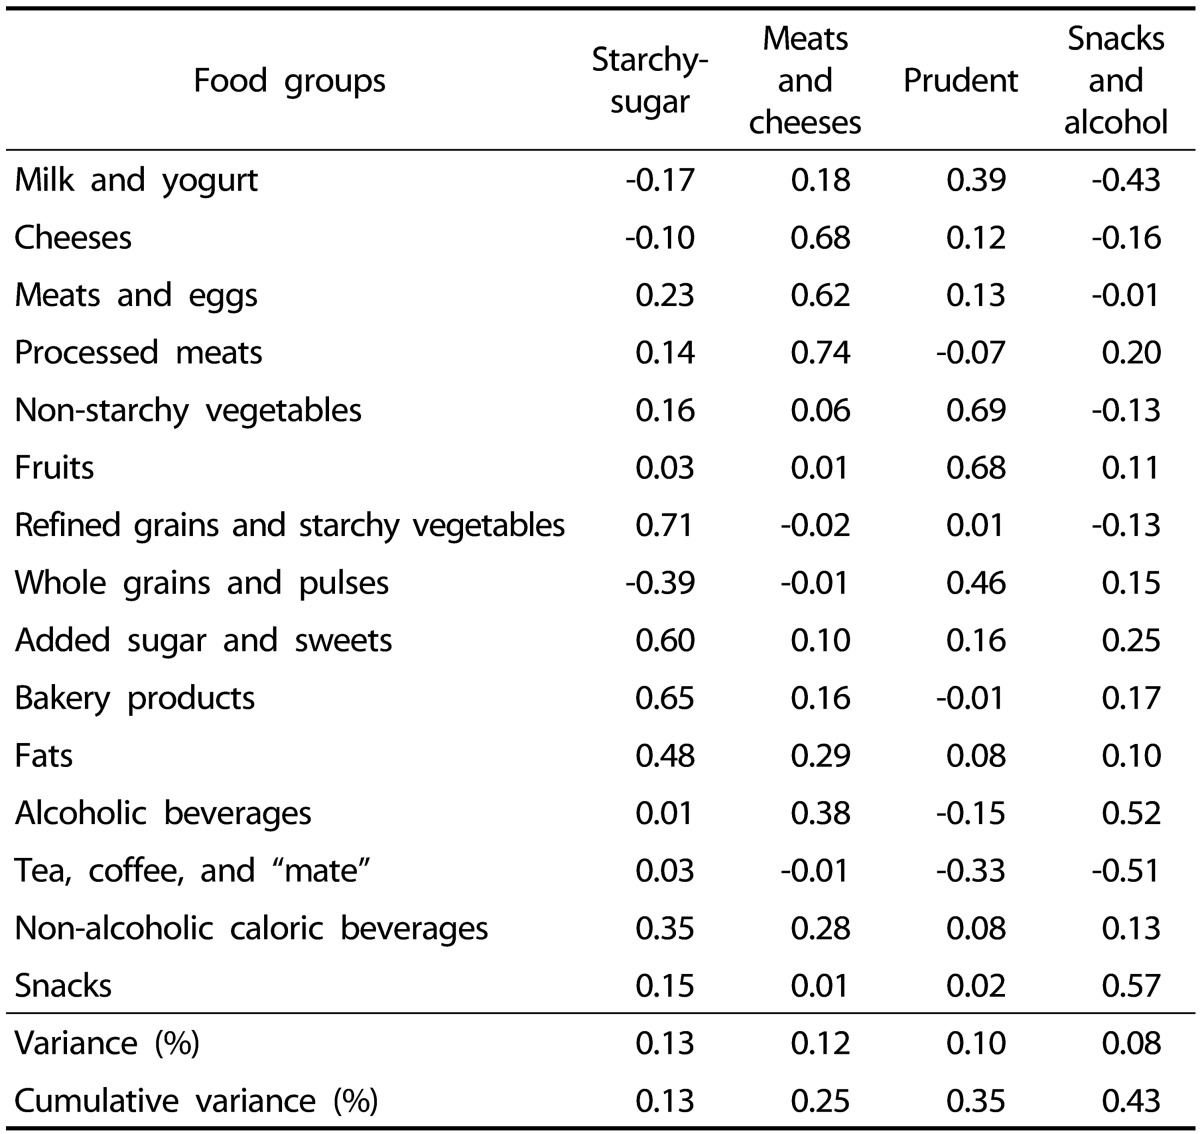
Table 4. Rotated factor loading matrix and explained variances for major dietary patterns identified by factor analysis for subjects with obesity (n = 735) in Córdoba city population, Argentina. CODIES 2005-2012.
Food groups with absolute rotated factor loading > 0.52, considered as dominant food groups for each factor, are shown in bold typeface.

