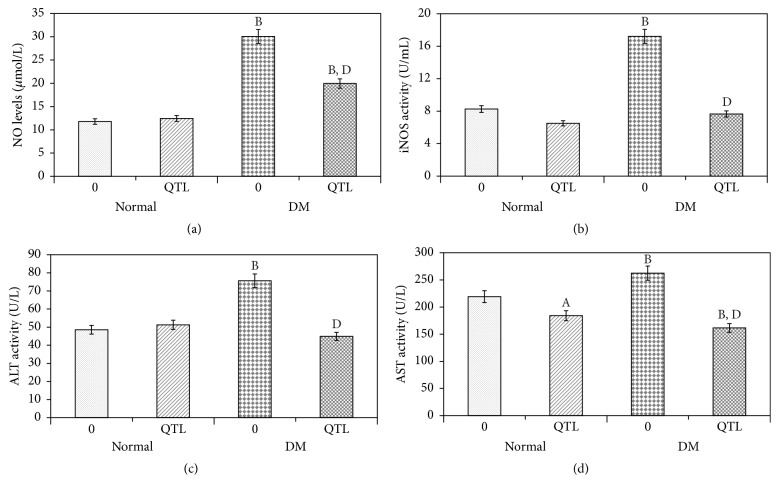
Figure 2.
Effects of QTL on oxidative stress and hepatic function markers in serum of normal and diabetic mice. NO level (a); iNOS activity (b); ALT activity (c); and AST activity (d). Data represent the mean ± SD from ten animals in each group. A P < 0.05 compared to control group; B P < 0.01 compared to control group; C P < 0.05 compared to diabetic group; D P < 0.01 compared to diabetic group.

