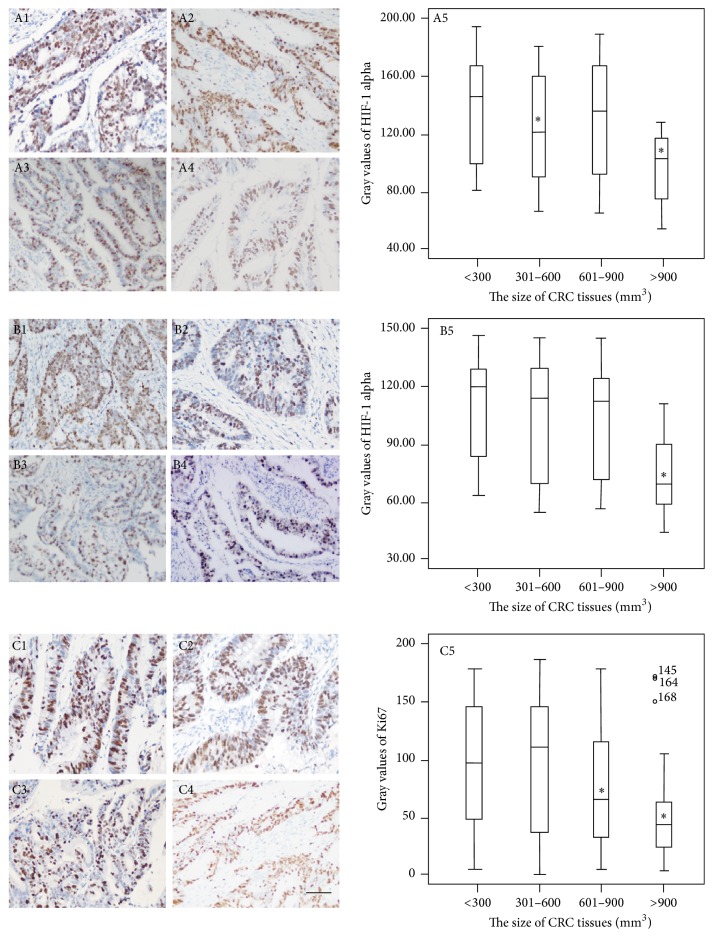
Figure 5.
Immunohistochemical analysis for the expression levels of Ki67 in different-size CRC tissues. The numbers of 1, 2, 3, 4, and 5 represent small-size tissues (<300 mm3, n = 36), middle-size tissues (301–600 mm3, n = 60), big-size tissues (601–900 mm3, n = 47), and super-size tissues (>900 mm3, n = 25) under 200x magnification and the gray values of Ki67, respectively. The letters (A), (B), and (C) represent Finefix, formalin-fixed, and Finefix-plus-microwave-fixed tissues, respectively. ∗ P < 0.05 via a small-size CRC tissue. Scale bar: 50 μm. The bars in the boxes were average activities and the boxes represented 90% of the samples. The error bars were above or below the boxes.

