Figure 1.

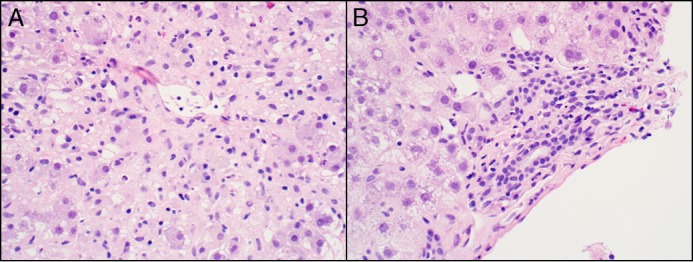
Liver biopsy. (A) High-power view of a central zone with confluent necrosis in zone 3 (400x magnification). (B) Hematoxylin and eosin stain of a portal tract with mild lymphoplasmacytic inflammation but intact ducts (400x magnification).

Liver biopsy. (A) High-power view of a central zone with confluent necrosis in zone 3 (400x magnification). (B) Hematoxylin and eosin stain of a portal tract with mild lymphoplasmacytic inflammation but intact ducts (400x magnification).