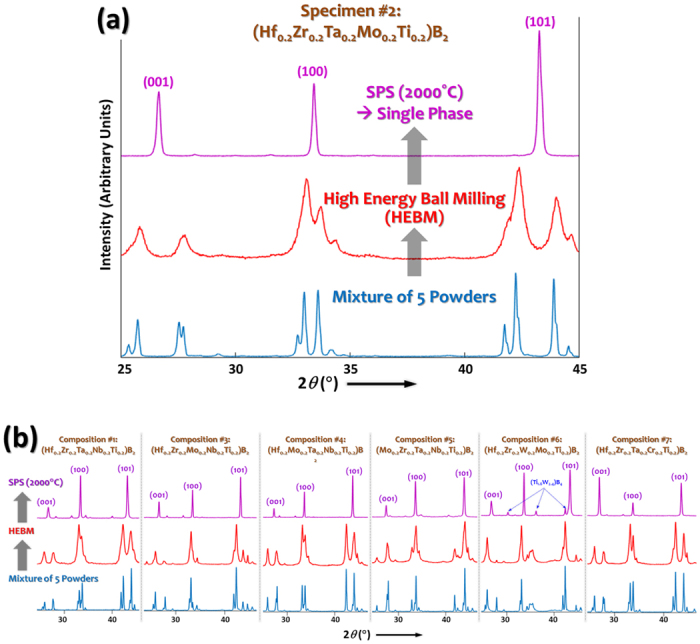
Figure 2.

XRD patterns showing the phase evolution during the HEBM and SPS fabrication processes in (a) HEB #2 as an examplar in an expanded scale and (b) six other specimens. Only the first three peaks of the high-entropy hexagonal AlB2 phases are shown here for figure clarity; full-range XRD patterns (of 2θ = 20°–100°, showing eleven XRD peaks of the high-entropy hexagonal phases) are documented in the Supplementary Figs S1–S7.
