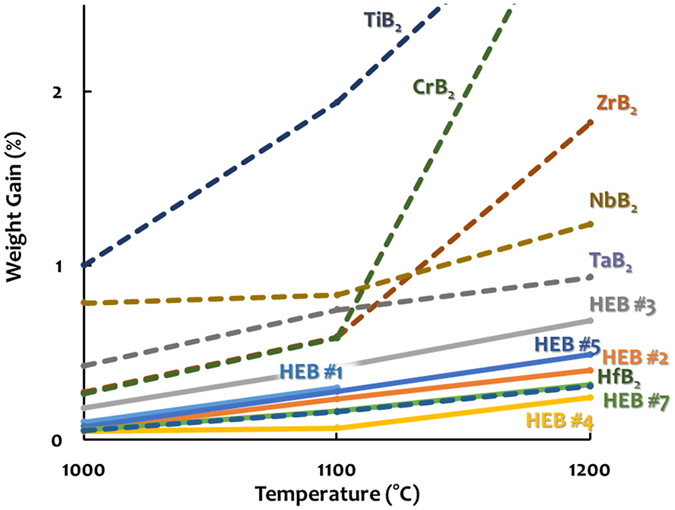
Figure 8. A snapshot of the relative oxidation performance of various high-entropy and individual metal diborides fabricated and tested with the same conditions.

This figure displays percentage weight gain vs. oxidation temperature curves during annealing in flowing dry air at 1000 °C, 1100 °C, and 1200 °C (for one hour each) sequentially for six single-phase high-entropy metal diborides [HEB #1 = (Hf0.2Zr0.2Ta0.2Nb0.2Ti0.2)B2, HEB #2 = (Hf0.2Zr0.2Ta0.2Mo0.2Ti0.2)B2, HEB #3 = (Hf0.2Zr0.2Mo0.2Nb0.2Ti0.2)B2, HEB #4 = (Hf0.2Mo0.2Ta0.2Nb0.2Ti0.2)B2, HEB #5 = (Mo0.2Zr0.2Ta0.2Nb0.2Ti0.2)B2, and HEB #7 = (Hf0.2Zr0.2Ta0.2Cr0.2Ti0.2)B2], along with six individual metal diborides fabricated via the same HEBM and SPS route. See the “Methods” section for the experimental procedure and Supplementary Figs S13–S15 for additional results, including weight gain per surface area plots, weight percentage gains at higher temperatures, and images of all specimens after oxidation at different temperatures. In this figure (and Supplementary Fig. S13), solid lines represent the high-entropy metal diborides and dashed lines represent the individual (conventional) metal diborides made by the same fabrication route.
