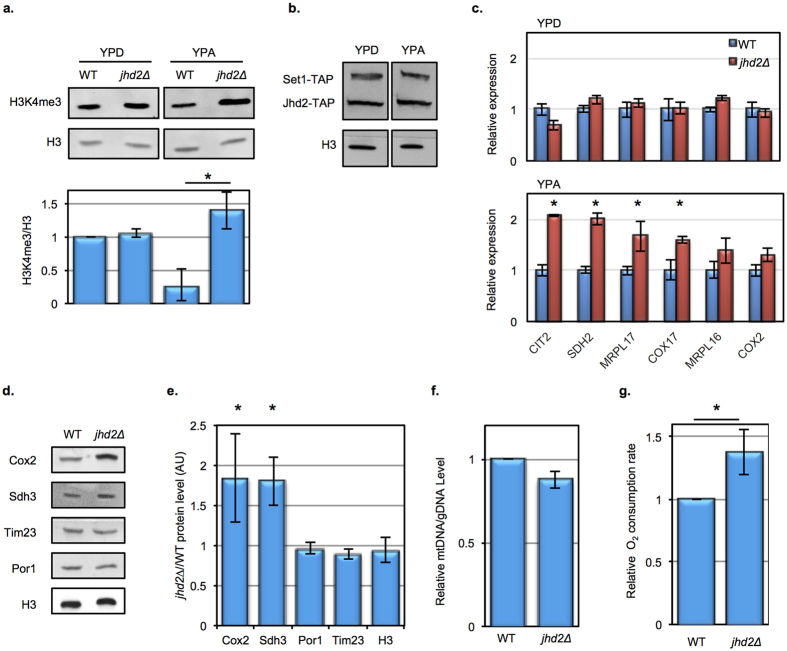
Figure 1. JHD2 restrains respiration in nonfermentable growth conditions.
(a) H3K4me3 and pan-H3 abundance in WT (MSY723) and jhd2Δ (MSY724) cells grown in the indicated media was measured using western blotting. The lower panel shows H3K4me3/H3 quantification for n = 3 normalized to WT in YPD with error bars depicting 1 standard deviation (s.d.). Significance as calculated by a two-tailed t-test is shown where *p = 0.006. (b) Western blot analysis of WT cells is shown with growth media indicated. Jhd2 and Set1 levels were determined using endogenous TAP tags using the strain MSY1074. (c) WT (MSY723) and jhd2∆ (MSY724) cells were grown in YPD or YPA, followed by RT-qPCR quantification of the indicated transcripts. n = 4, and error bars reflecting 1 s.d. are shown. Significance as calculated by a two-tailed t-test is shown where *p = 0.02 (CIT2), 0.006 (SDH2), 0.04 (MRPL17), and 0.05 (COX17). (d) WT and jhd2∆ cells were grown in YPA and extracts were analyzed by western blots probing for the indicated proteins. (e) The relative protein levels for 3 biological replicates with 1 s.d. error bars is shown where *p = 0.05 (Cox2) and 0.01 (Sdh3). (f) DNA was extracted from the same cells and relative levels of mtDNA (COX2) to a genomic locus (ECM5) were determined by qPCR. (g) Oxygen consumption rates were measured in WT and jhd2∆ strains grown in YPA, n = 3, 1 s.d. is shown. Significance as calculated by a two-tailed t-test is shown where *p = 0.02.

