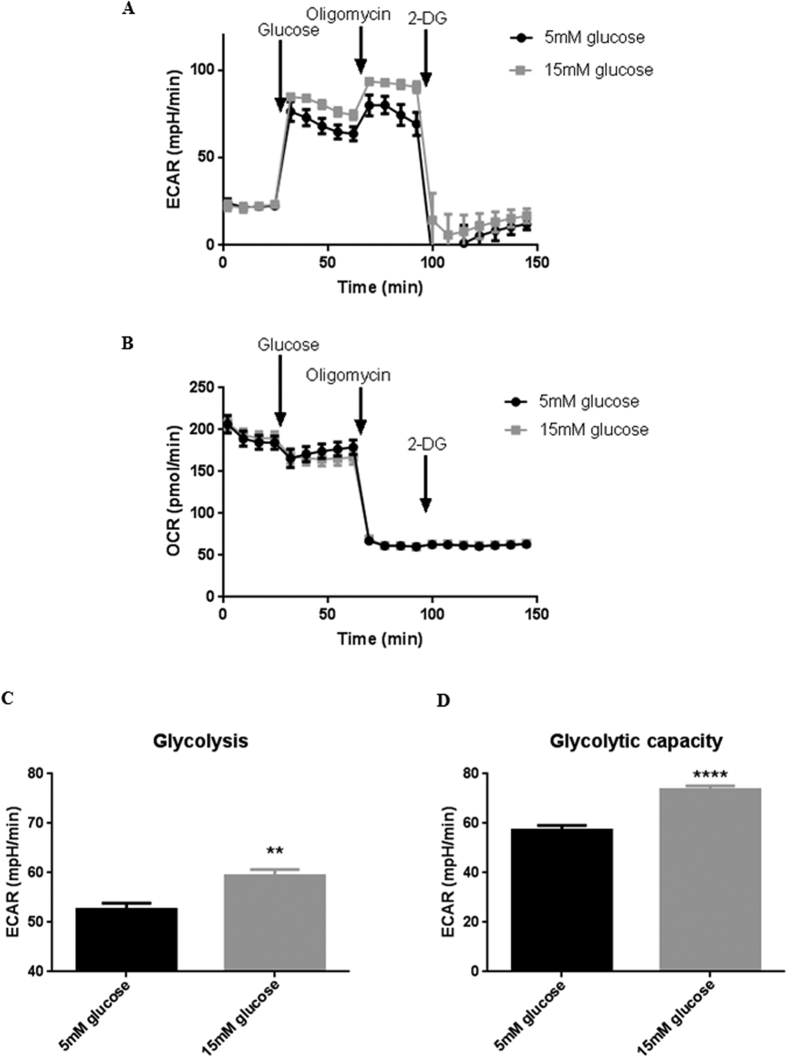
Figure 2. Hyperglycaemia induces a metabolic shift in airway epithelia towards aerobic glycolysis.
(A) ECAR measurement trace and (B) OCAR measurement trace during Seahorse Glycolysis Stress Assay in which the medium bathing the Calu-3 cells was injected with of 5 or 15 mM Glucose, 1 μM Oligomycin and 75 mM Oligomycin. (C) Glycolysis rate, calculated by subtracting the normalized ECAR values after 2-Deoxy-D-Glucose (2-DG) injection from the ECAR values after glucose injection, in order to exclude the non-glycolytic acidification from the calculation. (D) Glycolytic capacity, calculated by subtracting the non-glycolytic acidification rate (ECAR after 2-DG injection) from the maximum ECAR after 1 μM Oligomycin injection. **P < 0.01, ****P < 0.0001, n = 12. Data represent the means ± S.E.M.

