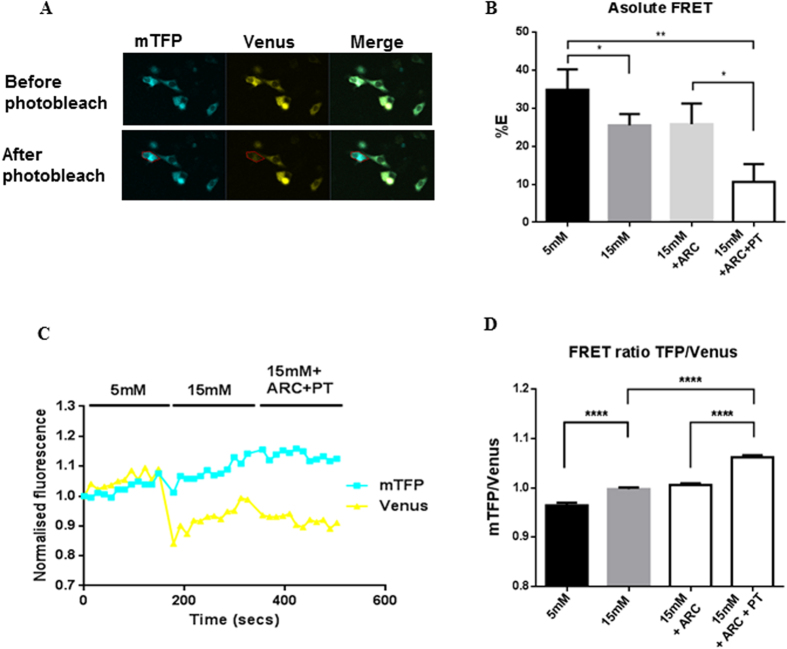
Figure 3. Hyperglycaemia induces an increase in intracellular lactate concentration.
Changes in intracellular lactate concentrations induced by increasing extracellular D-glucose from 5 to 15 mM with and without 100 nM AR-C155858 (ARC) or 50 μM phloretin (PT) measured using a lactate FRET sensor (Laconic) expressed in H441 cells. (A) Fluorescence images of mTFP (blue), Venus (yellow) and merged images in cells before and after photobleach. (B) Calculated FRET efficiency (%E). (C) FRET ratio (mTFP/Venus) in an exemplar H441 cell, over time course of treatments. (D) Collated FRET ratio data *P < 0.05, **P < 0.01, ***P < 0.001, n = 24. Data represent the means ± S.E.M.

