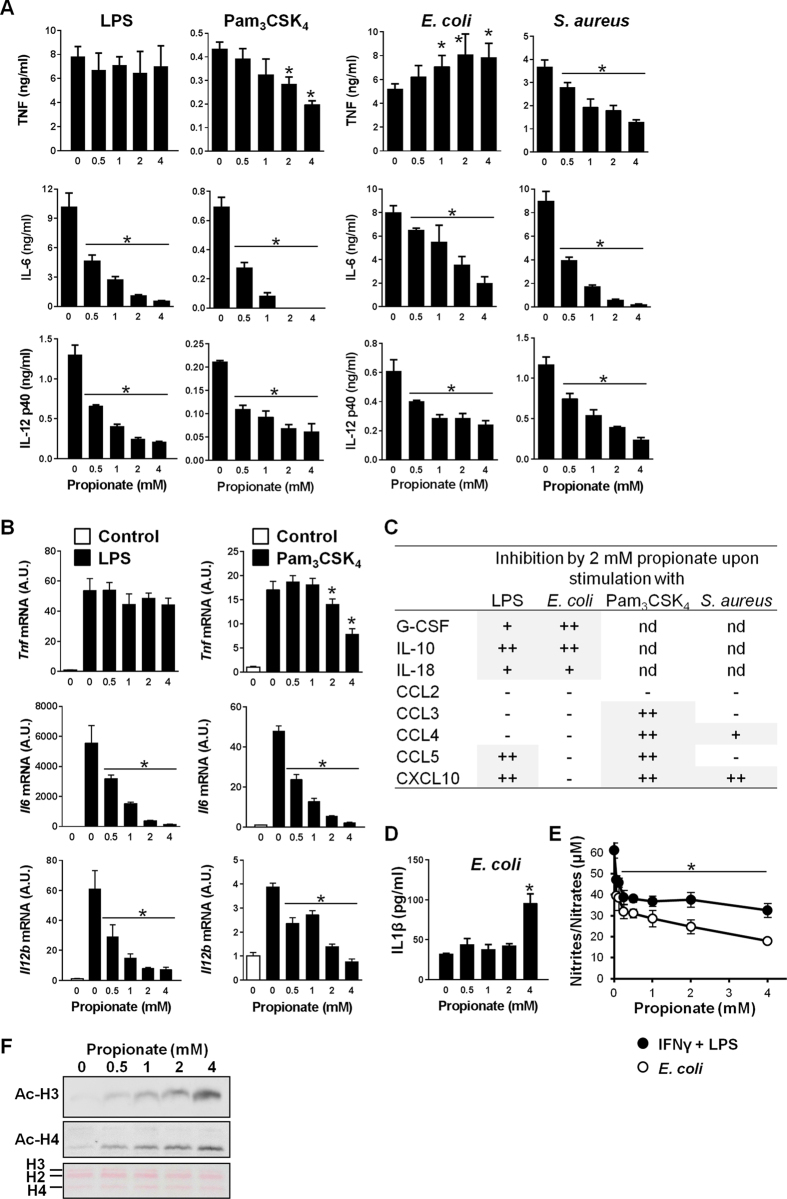
Figure 1. Impact of propionate on the response of macrophages to microbial stimulation.
BMDMs were pre-incubated for 1 h with increasing concentrations (0, 0.06, 0.12, 0.25, 0.5, 1, 2 and 4 mM) of propionate before exposure for 4, 8 or 24 h to LPS (10 ng/ml), Pam3CSK4 (10 ng/ml), E. coli (106 CFU/ml), S. aureus (107 CFU/ml) or a combination of IFNγ (100 U/ml) plus LPS (10 ng/ml). (A,B) TNF, IL-6 and IL-12p40 concentrations in cell culture supernatants and Tnf, Il6, Il12b mRNA levels were quantified by ELISA (A, t = 8 h) and real time-PCR (B, t = 4 h). No cytokine was detected in the supernatants of unstimulated cells (P < 0.001 vs stimulus alone). Tnf, Il6 and Il12b mRNA levels were normalized to Hprt mRNA levels. Data are means ± SD of triplicate samples from one experiment performed with 4 mice and representative of 2 experiments. *P < 0.05 vs stimulus without propionate. A.U.: arbitrary units. (C) The production of G-CSF, IL-10, IL-18, CCL2, CCL3, CCL4, CCL5 and CXCL10 was assessed by the Luminex technology (t = 8 h). Data summarize the impact of 2 mM propionate on mediators produced in response to LPS, E. coli, Pam3CSK4 and S. aureus: −, no inhibition; +, 1.5-2-fold inhibition; ++, >2-fold inhibition. Quantification is from one experiment performed with 4 mice. (D) IL-1β in cell culture supernatants. Data are means ± SD of triplicate samples from one experiment performed with 2 mice. *P < 0.05 vs no propionate. (E) Nitrites/nitrates were quantified using the Griess reagent (t = 24 h). Data are means ± SD of quadruplicate samples from one experiment performed with 4 mice. *P < 0.05 when comparing propionate at all concentrations vs no propionate. (F) Western blot analysis of acetylated histone 3 (Ac-H3) and Ac-H4 in BMDMs treated for 18 h with propionate. Ponceau staining of the membrane shows equal loading of total histones. Full-length blots are presented in Supplementary Figure S1.

