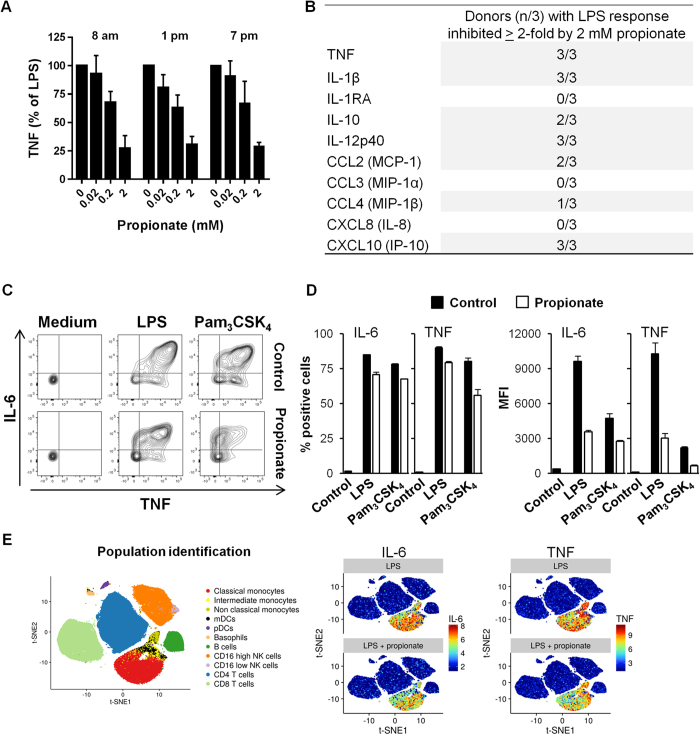
Figure 3. Impact of propionate on the response of human whole blood and monocytes.
Whole blood from 3 healthy subjects was incubated for 18 h with propionate and LPS (100 ng/ml). (A) TNF released by whole blood collected at 8 am, 1 pm and 7 pm was quantified by ELISA. Data are expressed as the percentage of maximal (LPS without propionate) TNF release. No TNF was detected in the absence of LPS stimulation (not shown). Data are means ± SD from 3 healthy subjects. P < 0.005 when comparing 0.2 and 2 mM propionate with 0 mM propionate. (B) TNF, IL-1β, IL-1RA, IL-10, IL-12p40, CCL2, CCL3, CCL4, CXCL8 and CXCL10 were quantified by Luminex. Results summarize the number of donors in whom propionate inhibited significantly (P < 0.05) and by at least 2-fold cytokine release. (C,D) PBMCs were incubated for 1 h with 2 mM propionate and stimulated for 4 h with LPS (100 ng/ml) and Pam3CSK4 (1 μg/ml). TNF and IL-6 expression in CD14+ monocytes was analyzed by flow cytometry to calculate the percentage of positive cells (C) and mean fluorescence intensity (MFI) (D). Data are means ± SD from one experiment performed with 2 donors. (E) Whole blood incubated for 4 h with 2 mM propionate and 100 ng/ml LPS was fixed with Smart Tube stabilizer, and processed by CyTOF as described in Materials and Methods. Left: t-SNE scatter plot of non-granulocyte events. Right: t-SNE plot with arcsinh transformed signal intensity of IL-6 and TNF. Data are representative of results obtained with 3 donors.

