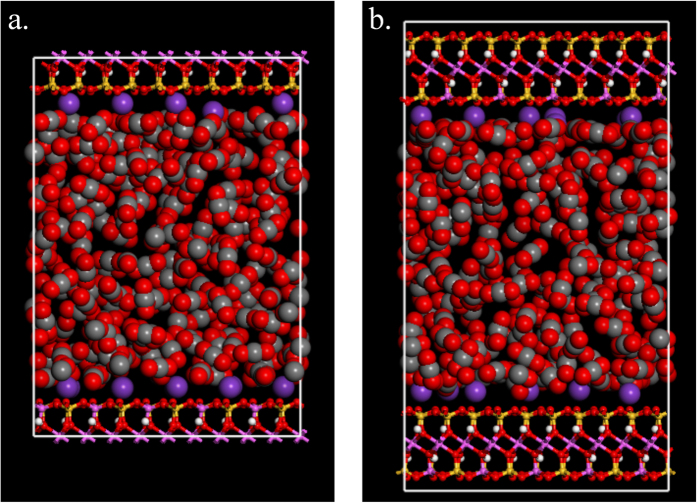
Figure 1.
A snapshot of (a) type I and (b) type II simulation cells with carbon dioxide molecules in between. Carbon dioxide molecules and potassium cations are represented by spheres and clay layers are represented by ball-stick structures, with the color scheme: O, red; H, white; Si, yellow; Al, pink; K, blue; C, grey. (For interpretation of the references to color in this figure legend, the reader is referred to the web version of this article).

