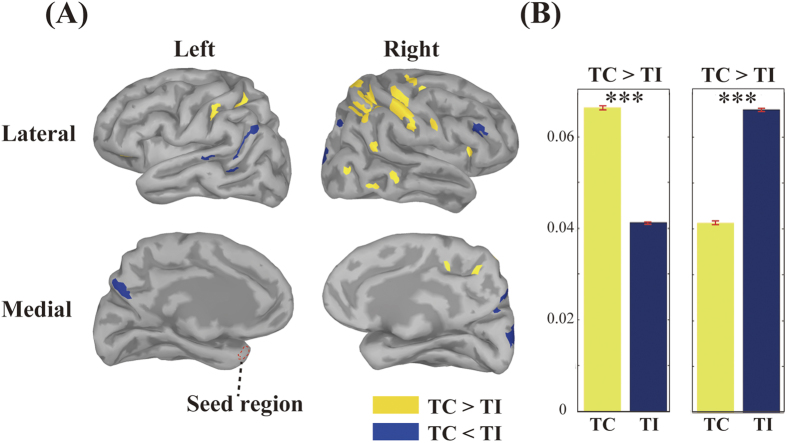
Figure 6. Imaginary coherence for each condition.
(A), The yellow colour indicates clusters that are significantly higher in the temporally congruent (TC) condition than the temporally incongruent (TI) condition. The blue colour shows clusters significantly higher in the TI condition than the TC. To create this figure, coherence values in each time window were averaged across multiple time windows to elucidate sustained long-range networks during the movie section. Significant TC clusters tended to overlap with the posterior parietal cortex, including the post-central areas bilaterally. On the other hand, significant TI clusters tended to converge in the occipital lobe, the superior temporal sulcus, and the right ventral lateral prefrontal cortex. Lateral views are shown at the top, medial views at the bottom. (B), The averaged coherence values. The left and right figures indicate the average of the significant clusters detected in the analysis. The left yellow bar denotes the averaged imaginary coherence value plotted in yellow in Fig. 6A, whereas the blue bar in the right figure indicates the mean value of the blue clusters mapped in the same figure. Each red bar indicates standard error. ***Bonferroni correction P < 0.001.

