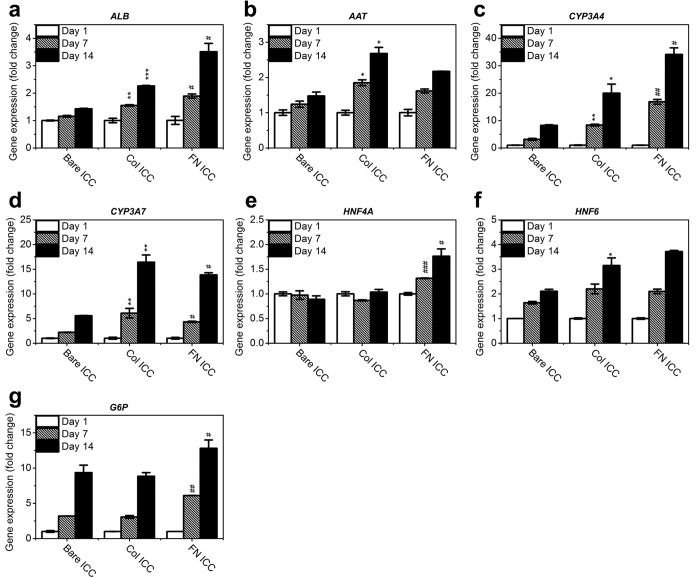
Figure 7. Gene expression of liver functional markers in Huh-7.5 cells on ICC scaffolds.
Quantitative real-time PCR analysis of the mRNA of specific genes was conducted, and the data were normalized to the housekeeping gene GAPDH. The results are presented as the fold change in the day 1 value of each respective group (mean ± SD, N = 3). Fold change comparison between the collagen-functionalized ICC and bare ICC groups: *p < 0.05; **p < 0.01; ***p < 0.001. Comparison of the fibronectin-functionalized ICC and collagen-functionalized ICC groups: #p < 0.05; ##p < 0.01; ###p < 0.001.

