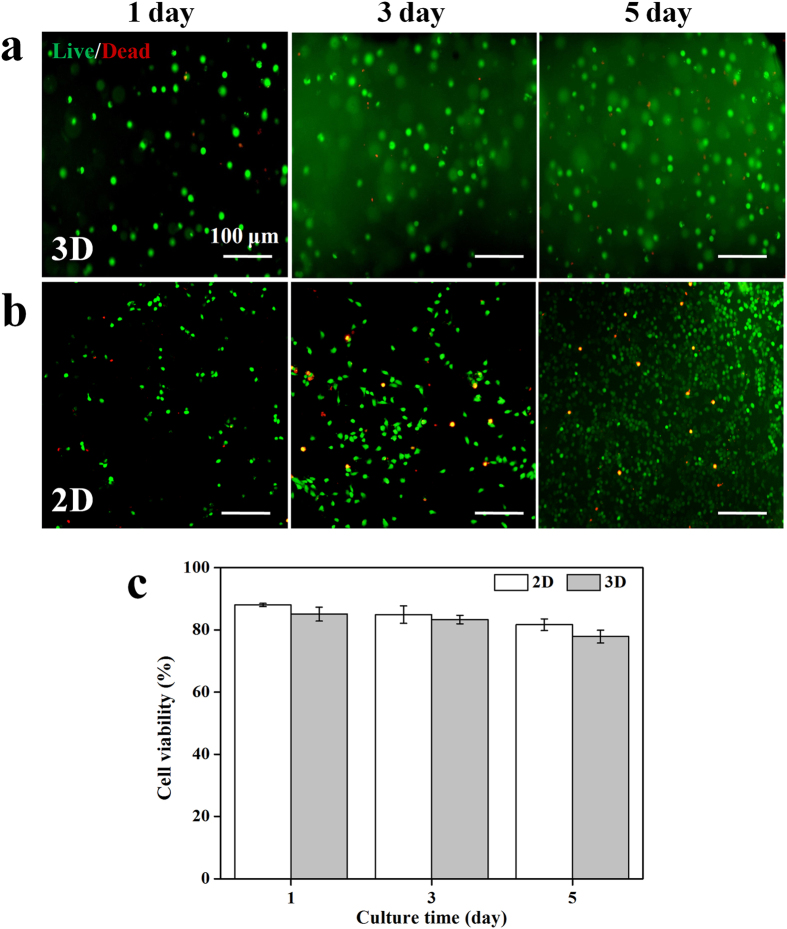
Figure 5. The cell viability of 3D and 2D cultures of NSCs.
(a) Live/Dead staining of NSCs loaded inside the 3D CEC-l-OSA hydrogels (Cc = 0.02 g/mL) for 1, 3 and 5 days. (b) Live/Dead staining of NSCs on the surface of tissue culture plastics for 1, 3 and 5 days. Live: green, dead: red. (c) The cell viability of NSCs under 2D and 3D conditions of different culture times of 1, 3 and 5 days. There is no significant difference on the cell viability between 3D and 2D groups. Error bars represent standard deviations (n = 3).

