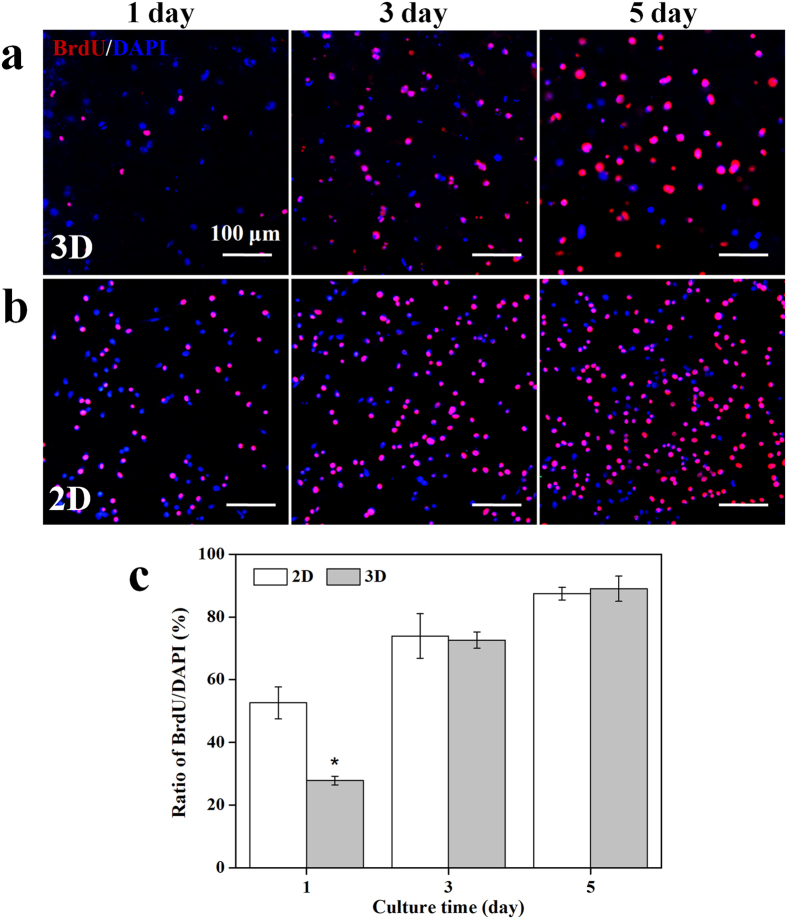
Figure 7. The proliferation of NSCs under 3D and 2D cultures.
(a) The proliferation of NSCs loaded inside the CEC-l-OSA hydrogels (Cc = 0.02 g/mL) for 1, 3 and 5 days, stained with BrdU/DAPI. (b) The proliferation of NSCs cultured on the surface of tissue culture plates for 1, 3 and 5 days, stained with BrdU/DAPI. All cell nuclei were stained with DAPI in blue, and the dividing cells were immunostained with anti-BrdU antibody in red. The cells with violet color derived from the overlay of blue and red color are the divided cells. (c) The percentage of proliferating cells, i.e., the ratio of BrdU positive cells to DAPI stained ones, at different culture times of 1, 3 and 5 days. *Symbol indicated the significant differences (p < 0.05) between 2D and 3D cultures. Error bars represent standard deviations (n = 3).

