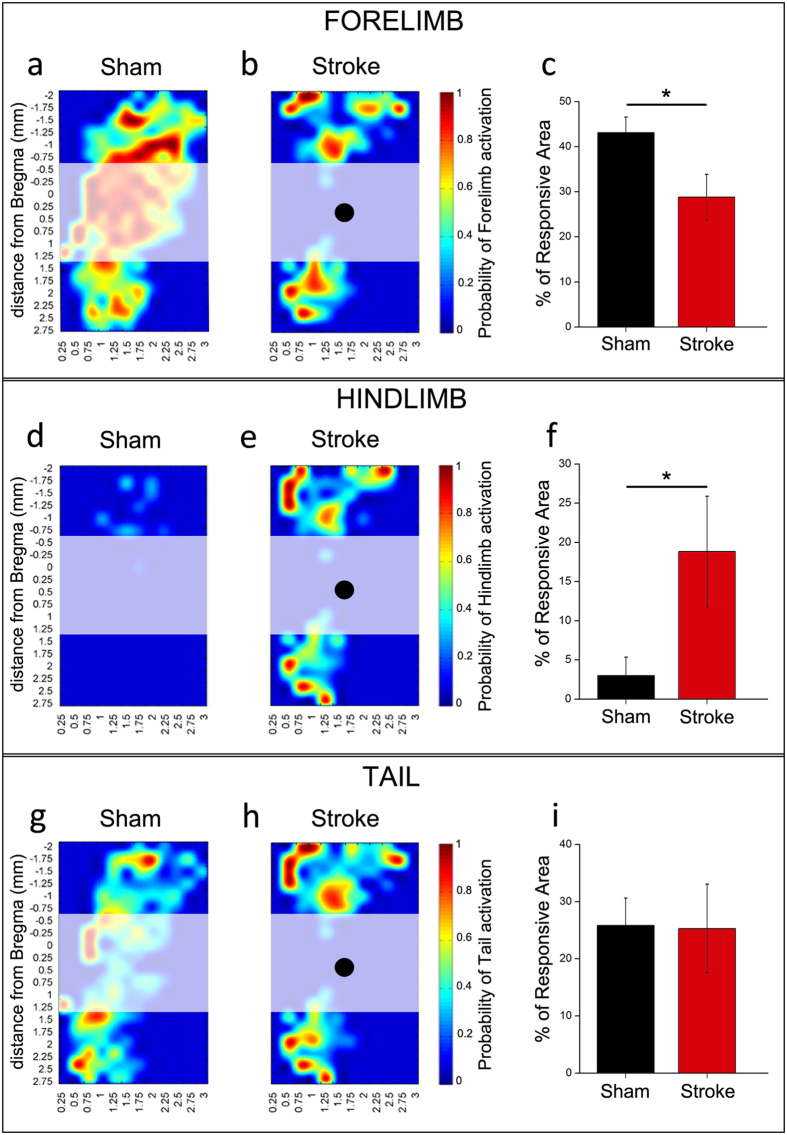
Figure 1. Plasticity of motor maps after stroke.
Average motor maps of sham (n = 9) and ischemic animals (n = 6) obtained by the intracortical microstimulation (ICMS) technique following a grid of stimulation site of 250 μm (see coordinates from bregma and Fig. 2a). For each pixel in the maps, a color code indicates the probability (high – red; low – blue) to elicit movement of a body part (contralateral forelimb in (a,b); contralateral hindlimb in (d,e); tail in (g,h) after stimulation with a train of cathodal pulses (current, 30 μA). The quantitative analysis was performed in healthy regions rostral and caudal to the stroke, excluding the infarct zone, which is indicated by the shaded areas (black dots indicate the center of the lesion). (c,f,i) Quantification of the percentage of perilesional motor areas eliciting forelimb (c), hindlimb (f) and tail responses (i) in sham and stroke animals. After stroke, there is a significant decrease in the cortical area that evokes forelimb responses (t-test, p < 0.05), with a corresponding expansion of hindlimb motor maps (t-test, p < 0.05). Tail representations are not altered by the infarct (t-test, p = 0.551). Data are mean ± SE.

