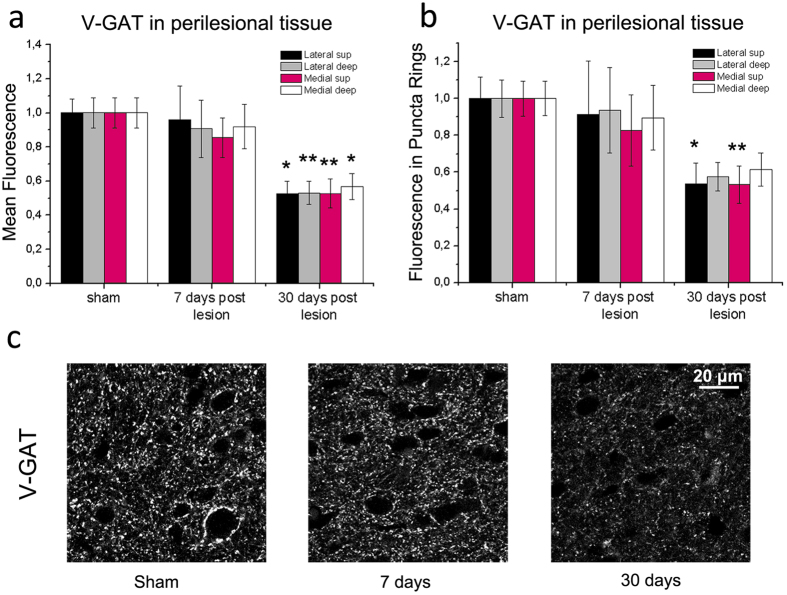
Figure 5. Late reduction of V-GAT-positive inhibitory terminals in perilesional cortex.
(a,b) Mean fluorescence intensity of inhibitory, V-GAT-positive profiles in the neuropil (a) and in puncta rings surrounding the soma of pyramidal neurons (b). Measures were taken in superficial (sup) and deep layers, medial and lateral to the infarct. A consistent reduction in fluorescence is observed 30 but not 7 days after injury as compared to sham controls (one way ANOVA followed by Holm-Sidak test, p < 0.05). Data are mean ± SE. *p < 0.05; **p < 0.01. (c) Representative V-GAT immunoreactivity in the motor cortex of sham animals and in perilesional tissues (7 and 30 days after the infarct). Note decreased staining at 30 days. Number of animals is as follows: control n = 5, stroke 7 days n = 5, stroke 30 days n = 4. Scale bar = 20 μm.

