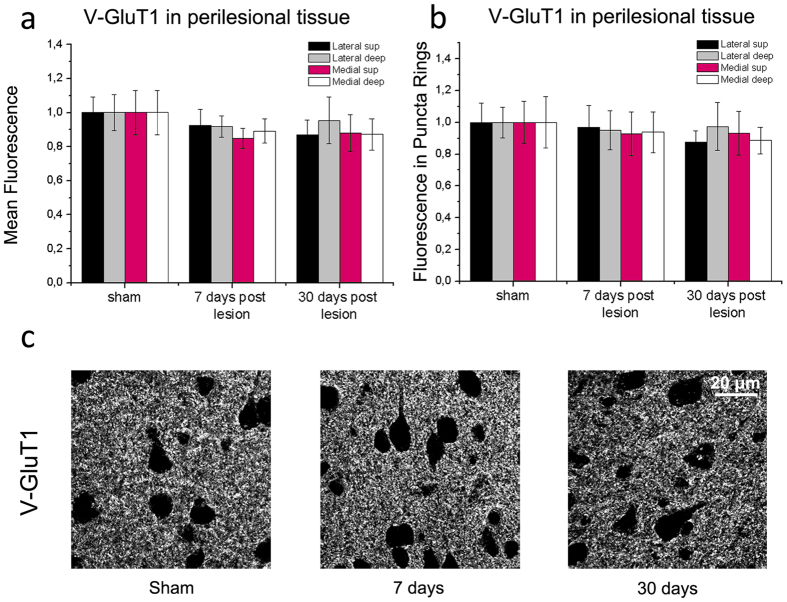
Figure 6. Quantitative analysis of V-GluT1 immunostaining.
(a,b) Mean fluorescence intensity of excitatory, V-GluT1-positive presynaptic structures in the neuropil (a) and in puncta rings surrounding the soma of pyramidal neurons (b). Measures were taken in superficial (sup) and deep layers, medial and lateral to the infarct. There is no significant variation in staining in stroke animals as compared to sham controls (one Way ANOVA, followed by Holm-Sidak test, p > 0.52). Data are mean ± SE. (c) Representative V-GluT1 staining in cortical sections from sham controls and stroke mice, 7 and 30 days following injury. Number of animals is as follows: control n = 6, stroke 7days n = 6, stroke 30 days n = 5. Scale bar = 20 μm.

