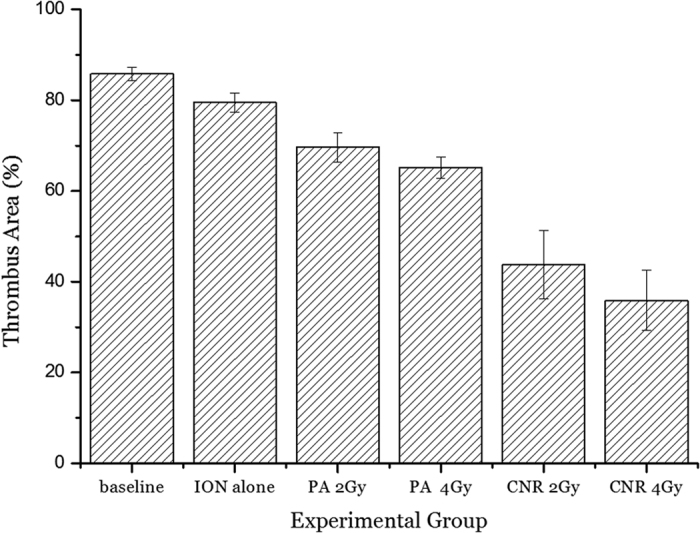
Figure 3. Average thrombus area measured at 7 days after treatment from the following treatment groups: baseline; untreated thrombosis mice as a basic control, IONs alone; thrombosis mice given only Fe3O4 nanoparticles, PA 2 Gy or 4 Gy; thrombosis mice given only proton irradiation with a plateau dose of 2 Gy or 4 Gy without nanoparticles, and CNR 2 Gy or 4 Gy; thrombosis mice given nanoparticles and proton irradiation with a plateau dose of 2 Gy or 4 Gy.

The thrombolytic effect was statistically evaluated by comparing the thrombus area in each CNR-treated mouse group with the thrombus area for proton irradiation alone. The ION alone and two PA groups were additional control groups used to estimate the significance of CNR-mediated thrombolytic efficacy in the CNR groups. Differences among the groups were assessed by one-way analysis of variance (ANOVA) followed by Student’s t-test using a contemporary statistical software package (GraphPad PrismTM; GraphPad Software, Inc., San Diego, CA, USA). For all tests, a value of p < 0.05 was considered significant.
