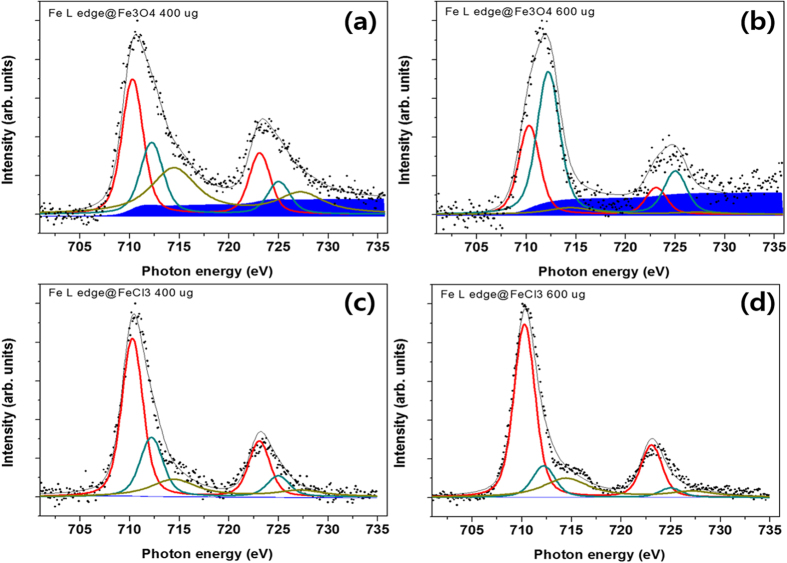
Figure 6.
Fe L-edge NEXAF spectra of Fe3O4 nanoparticle films ((a) 400 μg; (b) 600 μg) and FeCl3 films ((c) 400 μg; (d) 600 μg) on a silicon-nitride window substrate. Electron yields with kinetic energies of 3 eV were measured relative to the Fe-Fe ICD-associated electron emissions from IONs, which revealed large differences in the Shirley background levels of the nanoparticles and separate molecular species. The points represent the raw data and the grey curve is a fit taking into account the different fitted oxidation state contributions, representing Fe2+ (710.3 eV, red curve), Fe3+ (712.5 eV, dense green curve) and Fe2+ satellite (714.1 eV, faint green).

