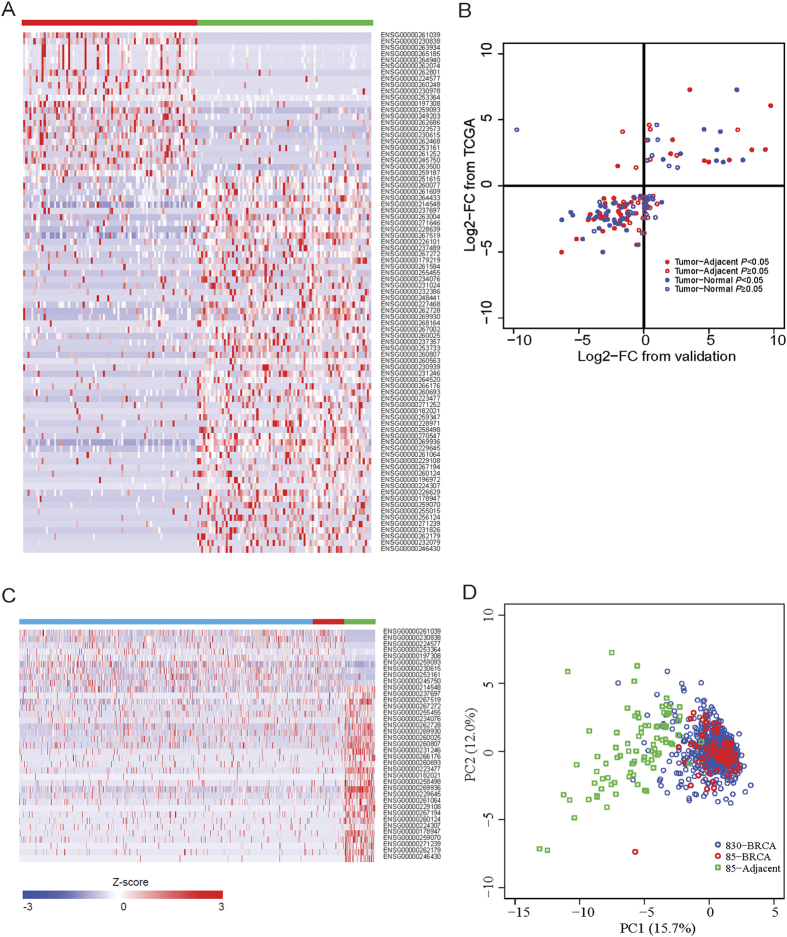
Figure 1. Expression differences of lincRNAs between human breast cancer and normal tissues.
(A) Heatmap of 83 differentially expressed lincRNAs in 85 pair-matched breast cancer samples. Red and green bars denote 85 breast cancer specimens and adjacent normal tissues from TCGA, respectively. Colors ranging from blue to red represent the relative expression levels (Z-score) of lincRNAs. (B) Dot plot of the Log2-transformed FC for 83 lincRNAs between 50 paired breast tumor and adjacent normal tissues (Tumor−Adjacent), and between 50 breast tumors and 23 normal tissues from healthy women (Tumor−Normal) as validation (X-axis) versus that from TCGA breast cancer patients (Y-axis). (C) Heatmap of 37 differentially expressed and replicated lincRNAs in 830 unmatched tumors (blue bar) in combined with 85 pairs of tumors (red bar) and adjacent normal tissues (green bar). Values range in color from blue to red, meaning the relative expression levels. (D) PCA of 85 paired breast cancer and adjacent normal samples (85 BRCA and 85 Adjacent) and 830 unpaired breast cancer samples (830 BRCA) based on 37 differentially expressed lincRNAs.

