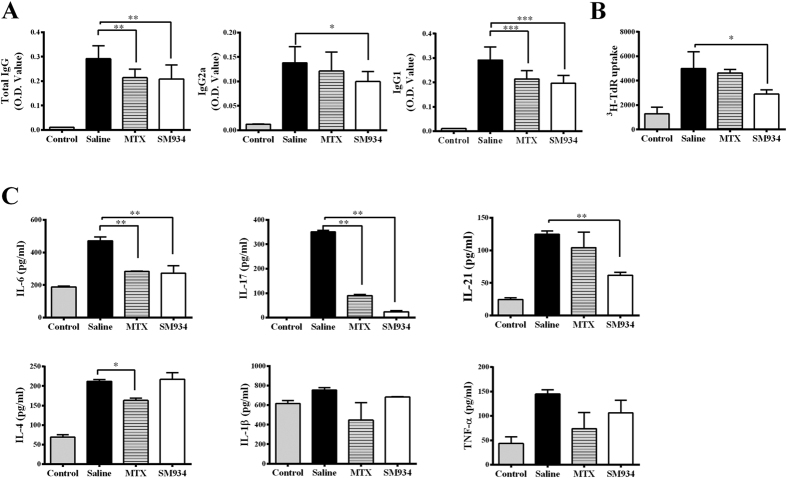
Figure 3. Effects of SM934 on CII-specific immune response in CIA mice.
(A) Serum levels of total anti-CII IgG, IgG2a and IgG1 of CIA mice and normal control mice. Values are the mean ± SEM (n = 8). *P < 0.05, **P < 0.01 and ***P < 0.001 compared with the saline-treated CIA mice (saline). (B) B cell-depleted splenocytes isolated from CIA mice were stimulated with CII (10 μg/ml) and cultured for 72 h. Cell proliferation was measured by the [3H]-thymidine incorporation assay. (C) Supernatants were collected for cytokines detection by ELISA. All data are showed as mean ± SEM. *p < 0.05, **p < 0.01 compared with the cell culture of saline-treated CIA mice (saline). Results are derived from 2 independent experiments with similar pattern in each treated group (n = 8 in each group).

