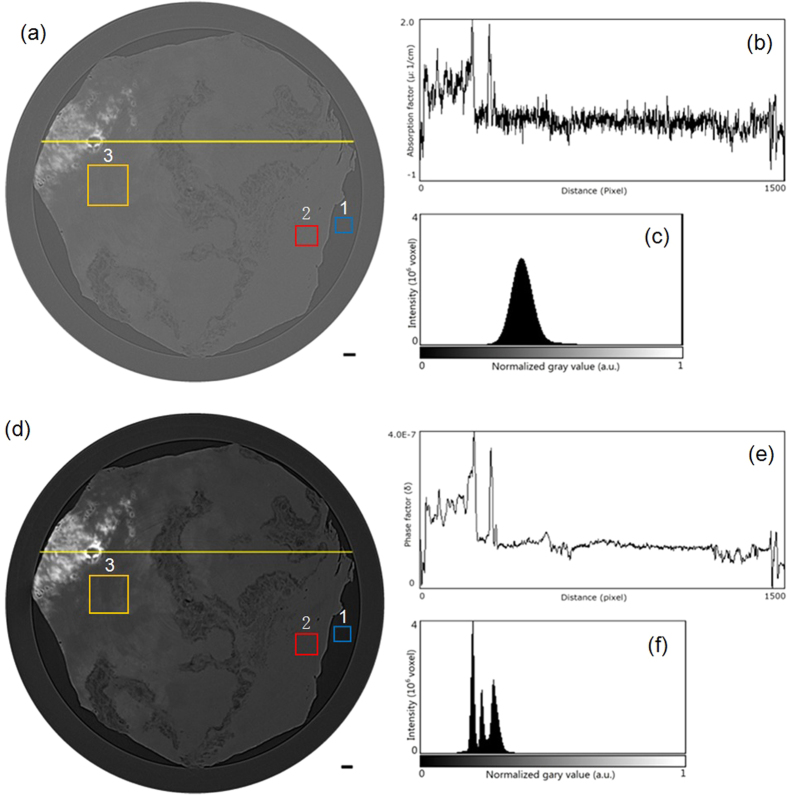
Figure 1.
Reconstructed phase-contrast sectional images of a human HAE lesion with a slice thickness of 5.2 μm by using SR-PPCT (a) and PR-based SR-PPCT (d) methods. Profile lines, shown in (b,e), were plotted along the yellow solid lines in (a,d). Histograms measured in (a,d) are displayed in (c,f). The rectangle regions 1 and 2, plotted in (a,d), were used for calculating the CNRs of both PPCT techniques, and region 3 was used for enlarged views of higher resolution measurements. The length of the scale bar is 150 μm.

