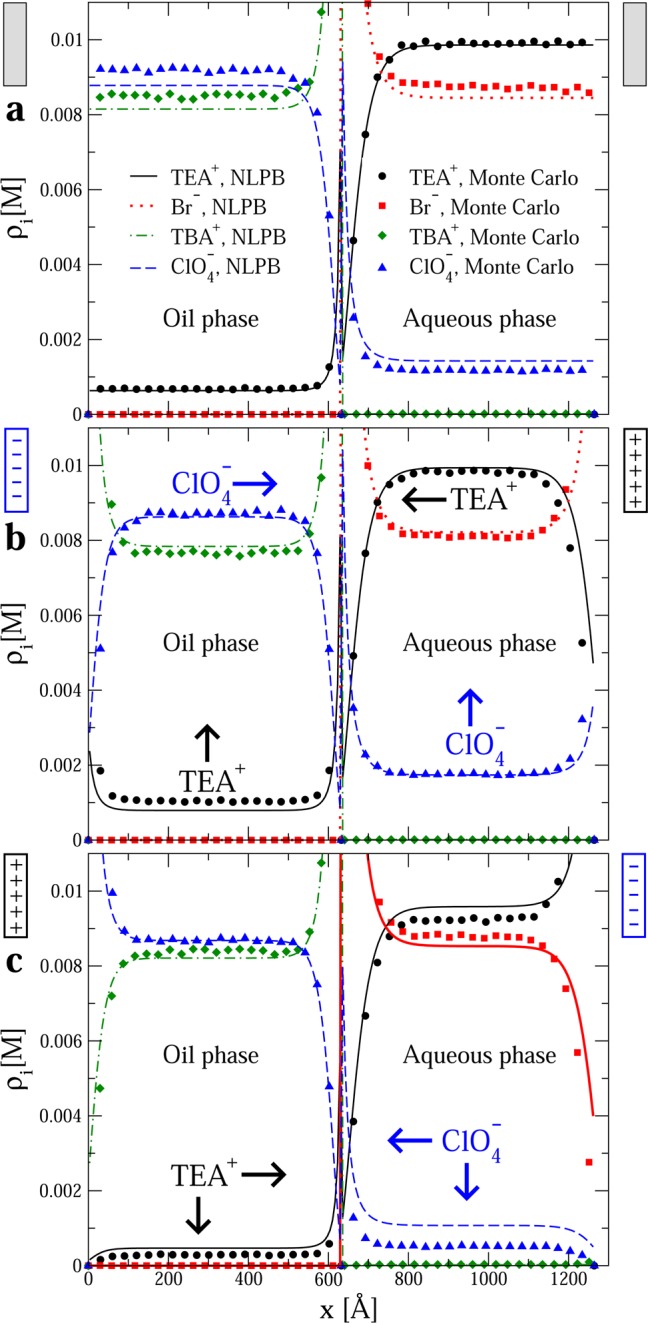
Figure 3.

Ionic profiles in the oil/water system. The initial electrolyte concentration was 0.01 M TBAClO4 in oil and 0.01 M TEABr in water in all instances. The surface charge density of the electrode immersed in the oil phase is 0 in panel a, −0.01 C/m2 in panel b, and 0.01 C/m2 in panel c. The surface charge density of the electrode immersed in the aqueous phase has the same magnitude but opposite sign. Horizontal and vertical arrows display the ionic transfer direction and the change of the bulk concentration in each solvent for species i, respectively, when the magnitude of the surface charge density of both electrodes is slightly increased. Filled symbols and lines correspond to Monte Carlo simulations and a nonlinear Poisson–Boltzmann theory, respectively.
