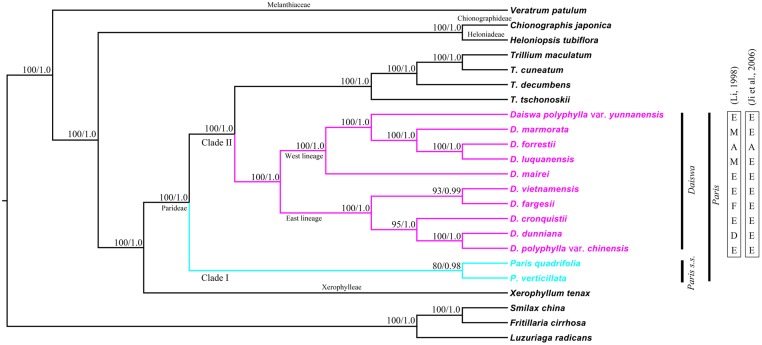
FIGURE 3.
Maximum likelihood (ML) phylogeny of Melanthiaceae based on complete chloroplast genomes inferred from 20 taxa representing all five tribes of the family. Numbers indicate bootstrap values >80% from the ML analyses and posterior probabilities >0.90 from the Bayesian inference (BI) analyses. Section delimitations in the Daiswa species reported by Li (1998) and Ji et al. (2006) are shown on the right. A, sect. Axiparis; D, sect. Dunnianae; E, sect. Euthyra; F, sect. Fargesianae; M, sect. Marmoratae.

