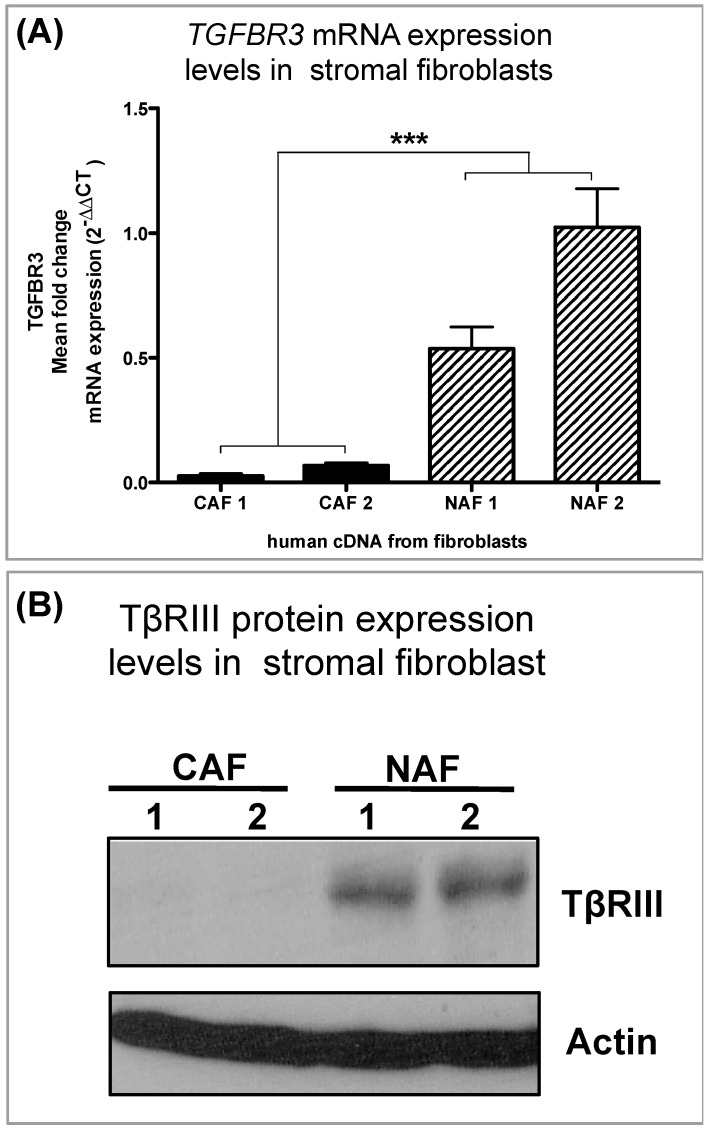
Figure 5.
In vitro validation of TGFBR3 protein and mRNA levels in human breast cancer fibroblast. (A) qPCR analysis of TGFBR3 from human cDNA from cancer-associated fibroblasts (CAFs) and normal-associate fibroblasts (NAFs); graph bars represent the mean of three replicates with SEM error bars (*** p < 0.0001; for a one-way ANOVA). (B) Western blot analysis of TβRIII protein expression in CAFs and NAFs. mRNA is normalized to GAPDH levels and relative to control and fold changes are given in log2 scale. Mean of four replicates with SEM error bars (*** p < 0.01 for unpaired two-tailed Student’s t-test).

