
Fig. 3.
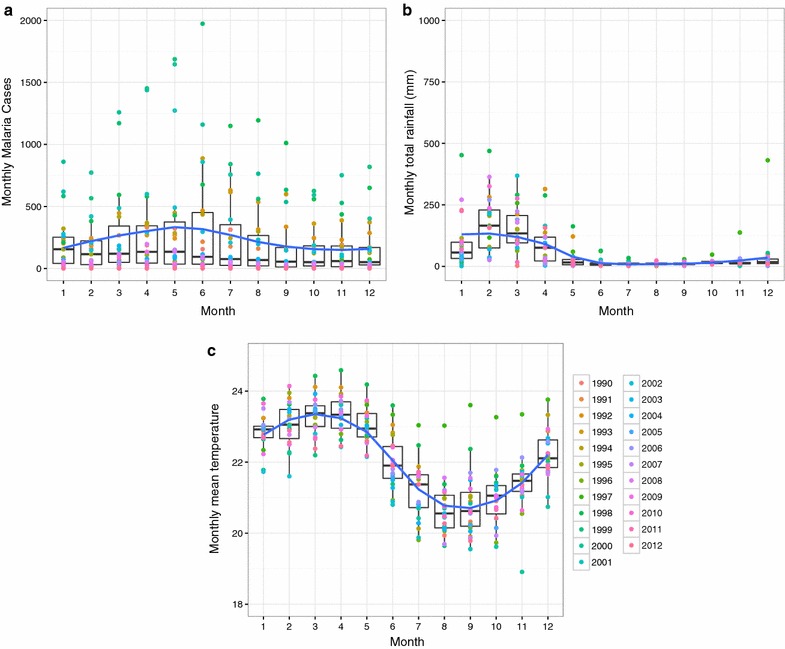
Seasonality of malaria and climate in El Oro (1990–2012). Box plots shown with a loess smoothing function for a monthly malaria cases, b total monthly rainfall, and c mean minimum air temperature
Official websites use .gov
A
.gov website belongs to an official
government organization in the United States.
Secure .gov websites use HTTPS
A lock (
) or https:// means you've safely
connected to the .gov website. Share sensitive
information only on official, secure websites.
Seasonality of malaria and climate in El Oro (1990–2012). Box plots shown with a loess smoothing function for a monthly malaria cases, b total monthly rainfall, and c mean minimum air temperature