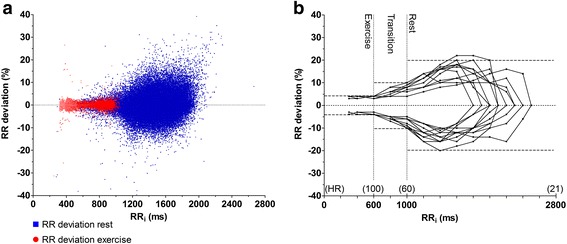
Fig. 4.

Zoom in on the main cluster in the RR deviation plot of a representative horse (a). The club-shape clearly illustrates that RR intervals at rest (blue) show larger RR deviation (RRdev) than RR intervals during exercise (red). Notice the slight asymmetry with a larger dispersion of positive values of RRdev at rest. The visually extrapolated margins of the main cluster of individual horses were superimposed for direct comparison (b). The dashed lines indicate heart rate ranges and threshold levels of maximum acceptable RR deviation. Note the consistent pattern of small RRdev with little inter-horse variation during exercise, gradual increase of RRdev in the transition from exercise to rest, and large inter-horse variation at rest
