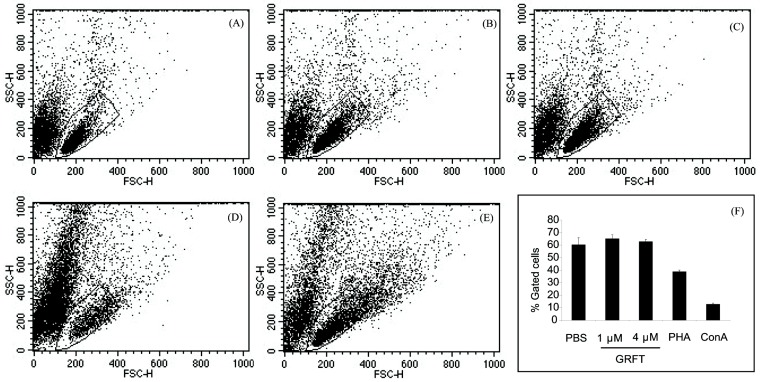
Figure 2.
Mitogenic properties of GRFT on mPBMCs. Cells were cultured for three days in the presence of PBS (A); 1 and 4 μM GRFT ((B,C), respectively); 0.37 μM ConA (D) and 10 μg/mL phytohemagglutinin (PHA) A (E). Dot plots reveal forward scatter (FSC) and side scatter (SSC) of cells after treatment. Typical inactivated mPBMC subpopulations were gated and quantitated (F).

