Figure 3.
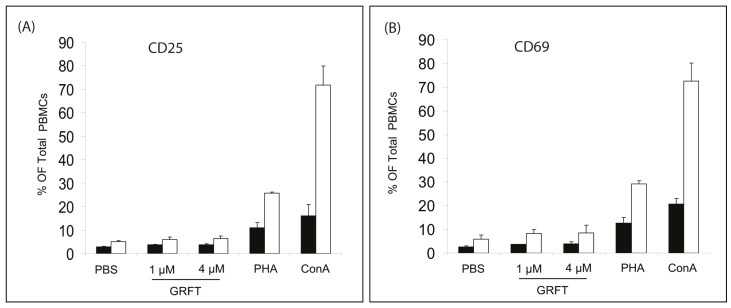
Effect of GRFT on the expression of cell surface activation markers in mPBMCs. Flow cytometry was performed after dual fluorescent staining with fluorescein isothiocyanate (FITC)-conjugated rat anti-CD4 mAb in combination with phycoerythrin (PE)-conjugated rat anti-CD25 or hamster anti-CD69. Cells were incubated in presence of PBS, 1 and 4 μM GRFT 0.37 μM ConA and 10 μg/mL PHA as indicated. (A) Represents the percentages of CD4+/CD25+ (black columns) and total CD25+ (white columns), whereas CD4+/CD69+ (black columns) and total CD69+ (white columns) ratios were plotted in (B).

