
Fig. 1.
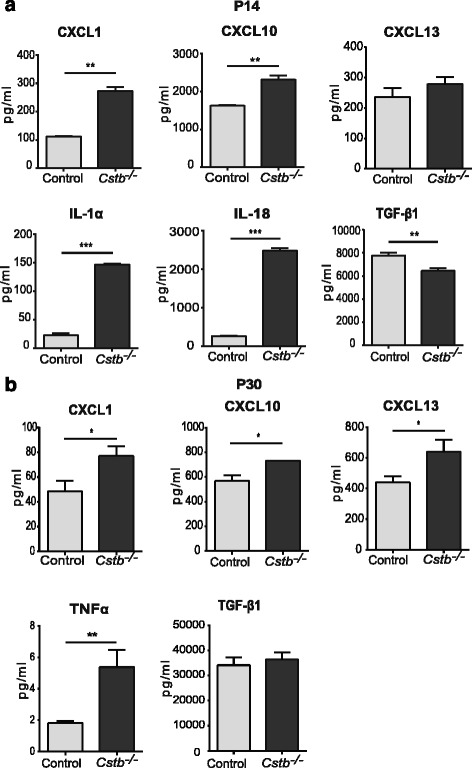
Cytokine levels in the serum of control and Cstb −/− mice. a Concentrations of CXCL1, CXCL10, CXCL13, IL-1α, IL-18, and TGF-β1 at P14 and b CXCL1, CXCL10, CXCL13, TNF-α, and TGF-β1 at P30. Data are presented as mean ± SEM (n = 3–6 per genotype; *p < 0.05, **p < 0.01, ***p < 0.001)