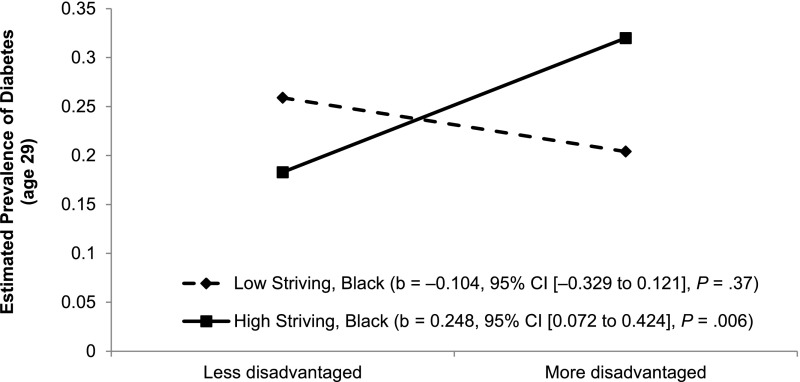
FIGURE 1.
Diabetes status at age 29 as a function of disadvantage and striving at age 16 for the black subsample. Diabetes status was defined as fasting glucose ≥126 mg/dL, nonfasting glucose ≥200 mg/dL, HbA1c ≥6.5%, self-reported history of diabetes, or the use of diabetes medication during the past 4 weeks. The lines represent the regression lines for different levels of striving (low: 1.5 SD below the mean; high: 1.5 SD above the mean). Numbers in parentheses refer to simple slopes. b, unstandardized regression coefficient; CI, confidence interval.

