
Fig. 2.
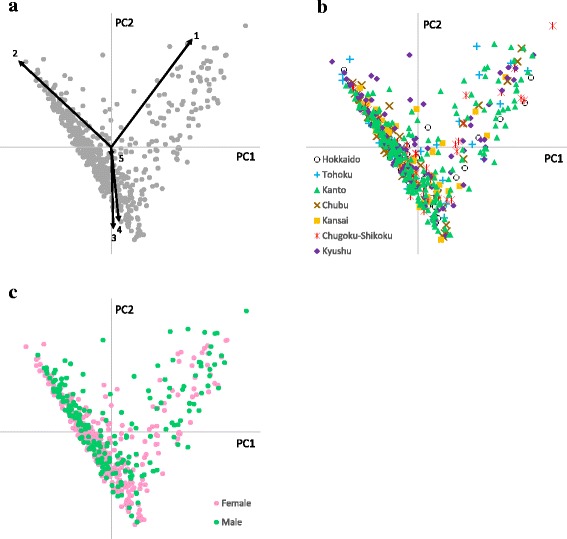
Biplots constructed based on the bacterial family composition of each subjects’ fecal microbiota. A principal component analysis of the bacterial family composition of each subjects’ fecal microbiota was performed, and a biplot in the PC1–PC2 dimension were constructed. The relative contributions of PC1 and PC2 were 54.1 and 25.7%, respectively. a The constructed biplot with an overlay showing the effects of the five most abundant bacterial families on plot location in the PC1–PC2 dimension (1. Prevotellaceae, 2. Bacteroidaceae, 3. Lachnospiraceae, 4. Ruminococcaceae, 5. Bifidobacteriaceae). b The biplot shown in (a) with the sample plots colored based on area of residence. c The biplot shown in (a) with the sample plots colored based on gender