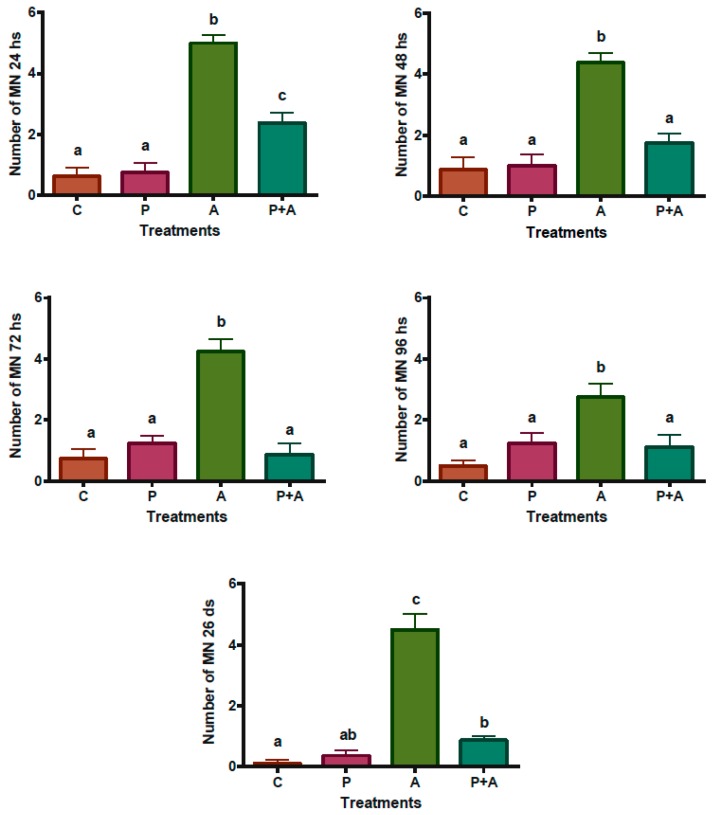
Figure 3.
Square root of the micronuclei mean, evaluated in 2000 erythrocytes from peripheral blood samples of broiler chickens. C: Control; P: 60 mg·piperine·kg−1 feed; A: 0.5 mg·AFB1/kg body weight; P + A: 60 mg·piperine·kg−1 feed plus 0.5 mg·AFB1/kg body weight; at 24, 48, 72, and 96 h, and 26 days. Data were normalized after processing the roots. a–c Means and standard deviation (error bars) compared by the Student-Newman-Keuls test; means with the same letters are not statistically different (p > 0.05).

