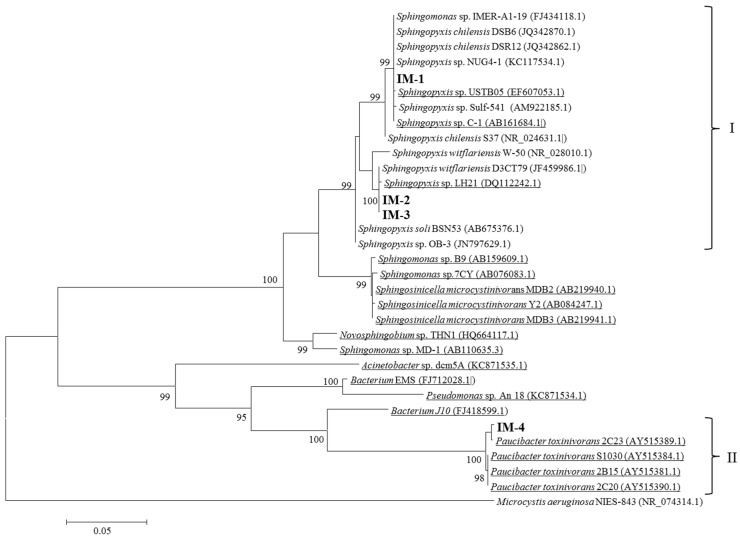
Figure 3.
Maximum likelihood tree based on the 16S rRNA gene (1344–1420 bp) showing, in bold, the position of the sequences obtained in the present study. The numbers near nodes indicate bootstrap values greater than or equal to 95, as a percentage of 1000 replicates resulting from the analysis. Underlined sequences indicate already known MCs-degrading bacteria. Bar, 0.05 substitutions per nucleotide position. Cluster I represents Sphingopyxis sp. and cluster II, Paucibacter toxinivorans.

