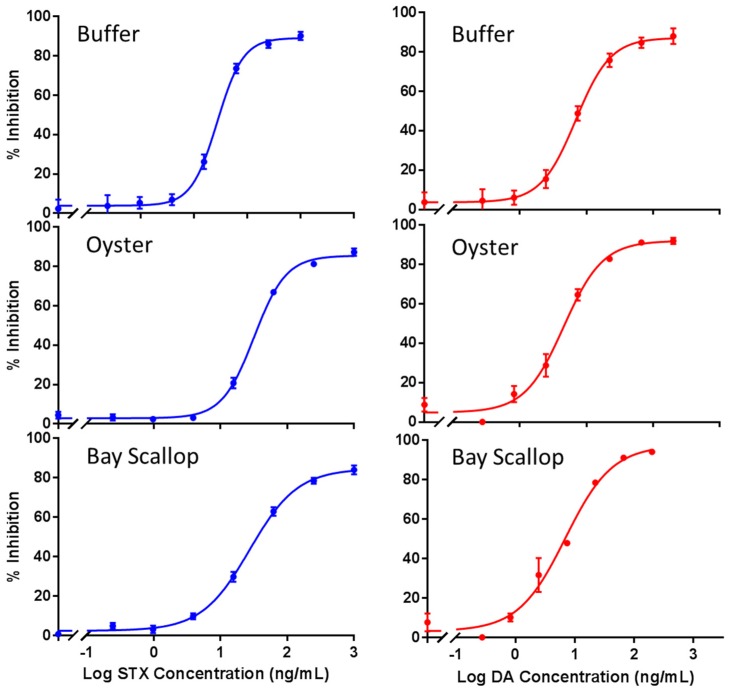
Figure 4.
Dose response curves for STX and DA. The left side is % inhibition of the dose responses for STX in buffer (top), oysters (middle), and bay scallops (bottom). The right side is % inhibition of the dose response curves for DA in buffer (top), oysters (middle), and bay scallops (bottom). Data shown are from four to six replicates plus their SEMs.

