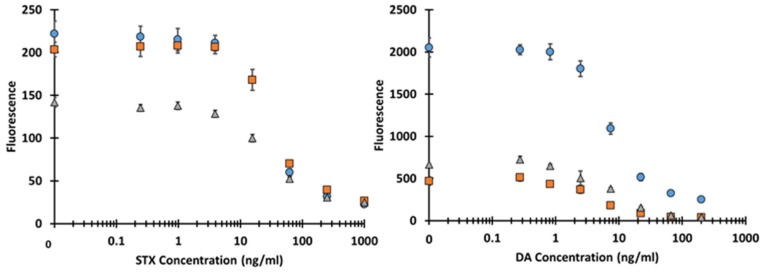
Figure 5.
Average fluorescence dose response curves for STX and DA. The left side is STX dose responses in buffer (blue circles), oysters (orange squares), and bay scallops (grey triangles) and the right is DA. Each point represents the average of both bead sets for three experiments plus their SEMs.

