. 2016 Aug 8;39(4):646–657. doi: 10.1590/1678-4685-GMB-2015-0323

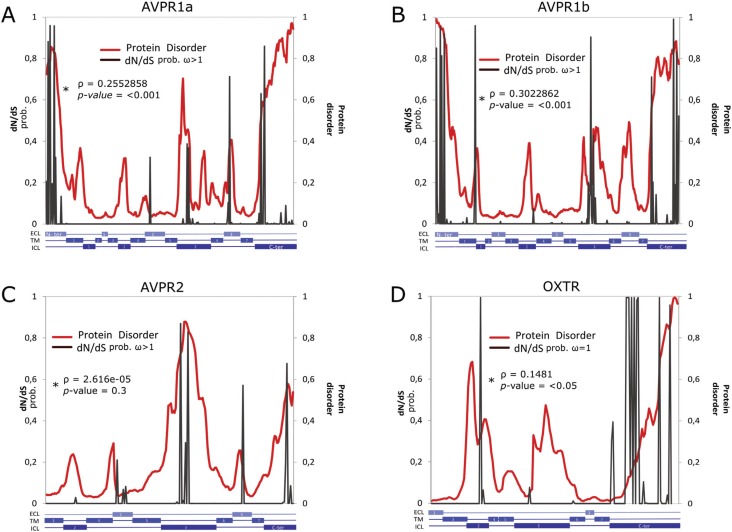
Figure 2. Bayes Empirical Bayes analyses. The probability of ω > 1 (sites under positive selection and/or relaxed constraint; A-C) or probability of ω = 1 (sites under neutrality and/or relaxed purifying selection; D) is shown in gray. Disorder degree (red) estimated for each residue of Homo sapiens AVPR1a (A), AVPR1b (B), AVPR2 (C), and OXTR (D). ECL: Extracellular; TM: Transmembrane; ICL: Intracellular. Patterns similar to those of other mammalian species were obtained (Table 3). ω = nonsynonymous/synonymous rate ratio. *Rho= Correlation between disorder value and the probability of being under positive selection or relaxed constraint.

Figure 2