. 2016 Oct 20;39(4):629–645. doi: 10.1590/1678-4685-GMB-2015-0327

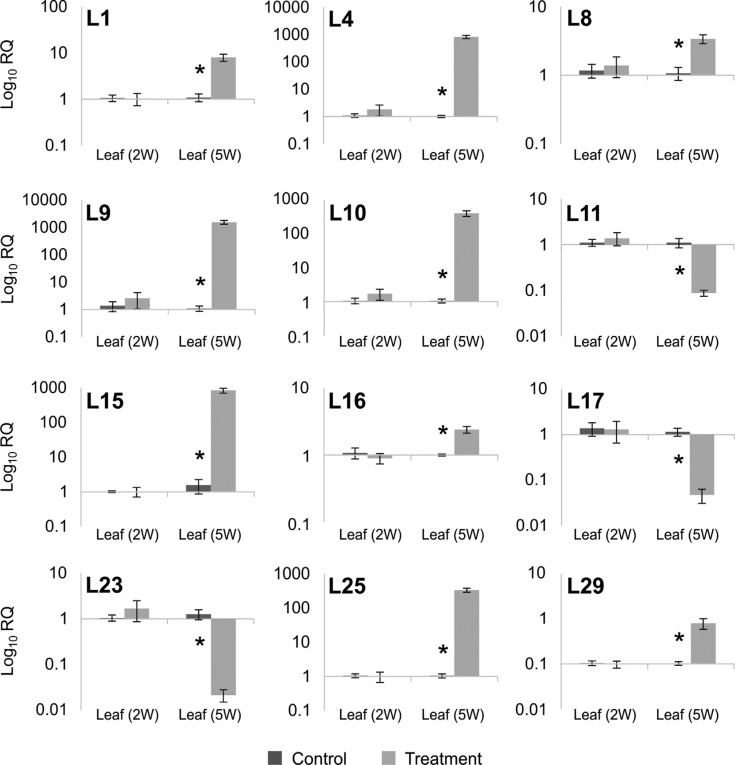
Figure 3. RT-qPCR analysis of selected leaf transcripts. Expression is shown for the 12 transcripts that were validated by RT-qPCR. Wheat leaves were sampled from two week-old (2 W) plants, where control plants were irrigated at 100% of field capacity (FC) and treated plants were irrigated at 75% FC. Five-week-old (5 W) plants are represented by control plants irrigated at 100% FC, and treated plants, where irrigation was withdrawn for three weeks. The experiment was performed in triplicate biological samples, with technical triplicates for each. Relative expression was calculated by the 2−ΔΔct method. Asterisks represent significantly different (Student's t-test, p ≤ 0.05) transcript levels. For more details on primers see Table 2 and Table S2 (16.3KB, pdf) .

Figure 3