. 2016 Oct 20;39(4):629–645. doi: 10.1590/1678-4685-GMB-2015-0327

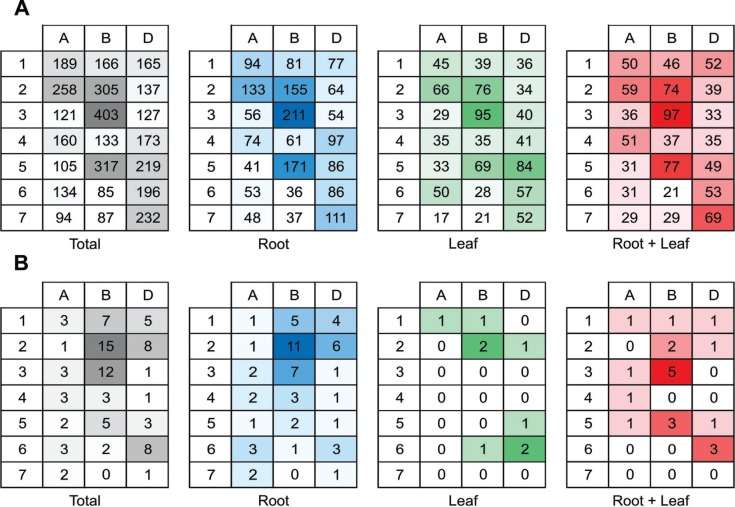
Figure 8. Heat map showing the localization of the candidate genes associated to drought response in the wheat cultivar MGS1 Aliança. Hit distribution by tissue was obtained by BLAST against the genome of Triticum aestivum cv. Chinese spring at an E-value cutoff 1e-100. Numbers represent the hit distribution for each chromosome. "Total" means hit distribution of all sequences. "Root" means hit distribution of transcripts specifically expressed in roots. "Leaf" means hit distribution of transcripts specifically expressed in leaf. "Root + Leaf" means hit distribution of transcripts expressed in common between root and leaf. Darker colors mean higher number of reads. (A) All the candidate genes. (B) Only the candidate genes classified as no-hit.

Figure 8